matplotlib画图
Posted pengweiblog
tags:
篇首语:本文由小常识网(cha138.com)小编为大家整理,主要介绍了matplotlib画图相关的知识,希望对你有一定的参考价值。
基本图像
import numpy as np
import matplotlib.pyplot as plt

plt.rcParams[‘font.sans-serif‘] = [‘Arial‘]  # 如果要显示中文字体,则在此处设为:SimHei
plt.rcParams[‘axes.unicode_minus‘] = False  # 显示负号

x = np.array([1, 2, 3, 4, 5, 6])
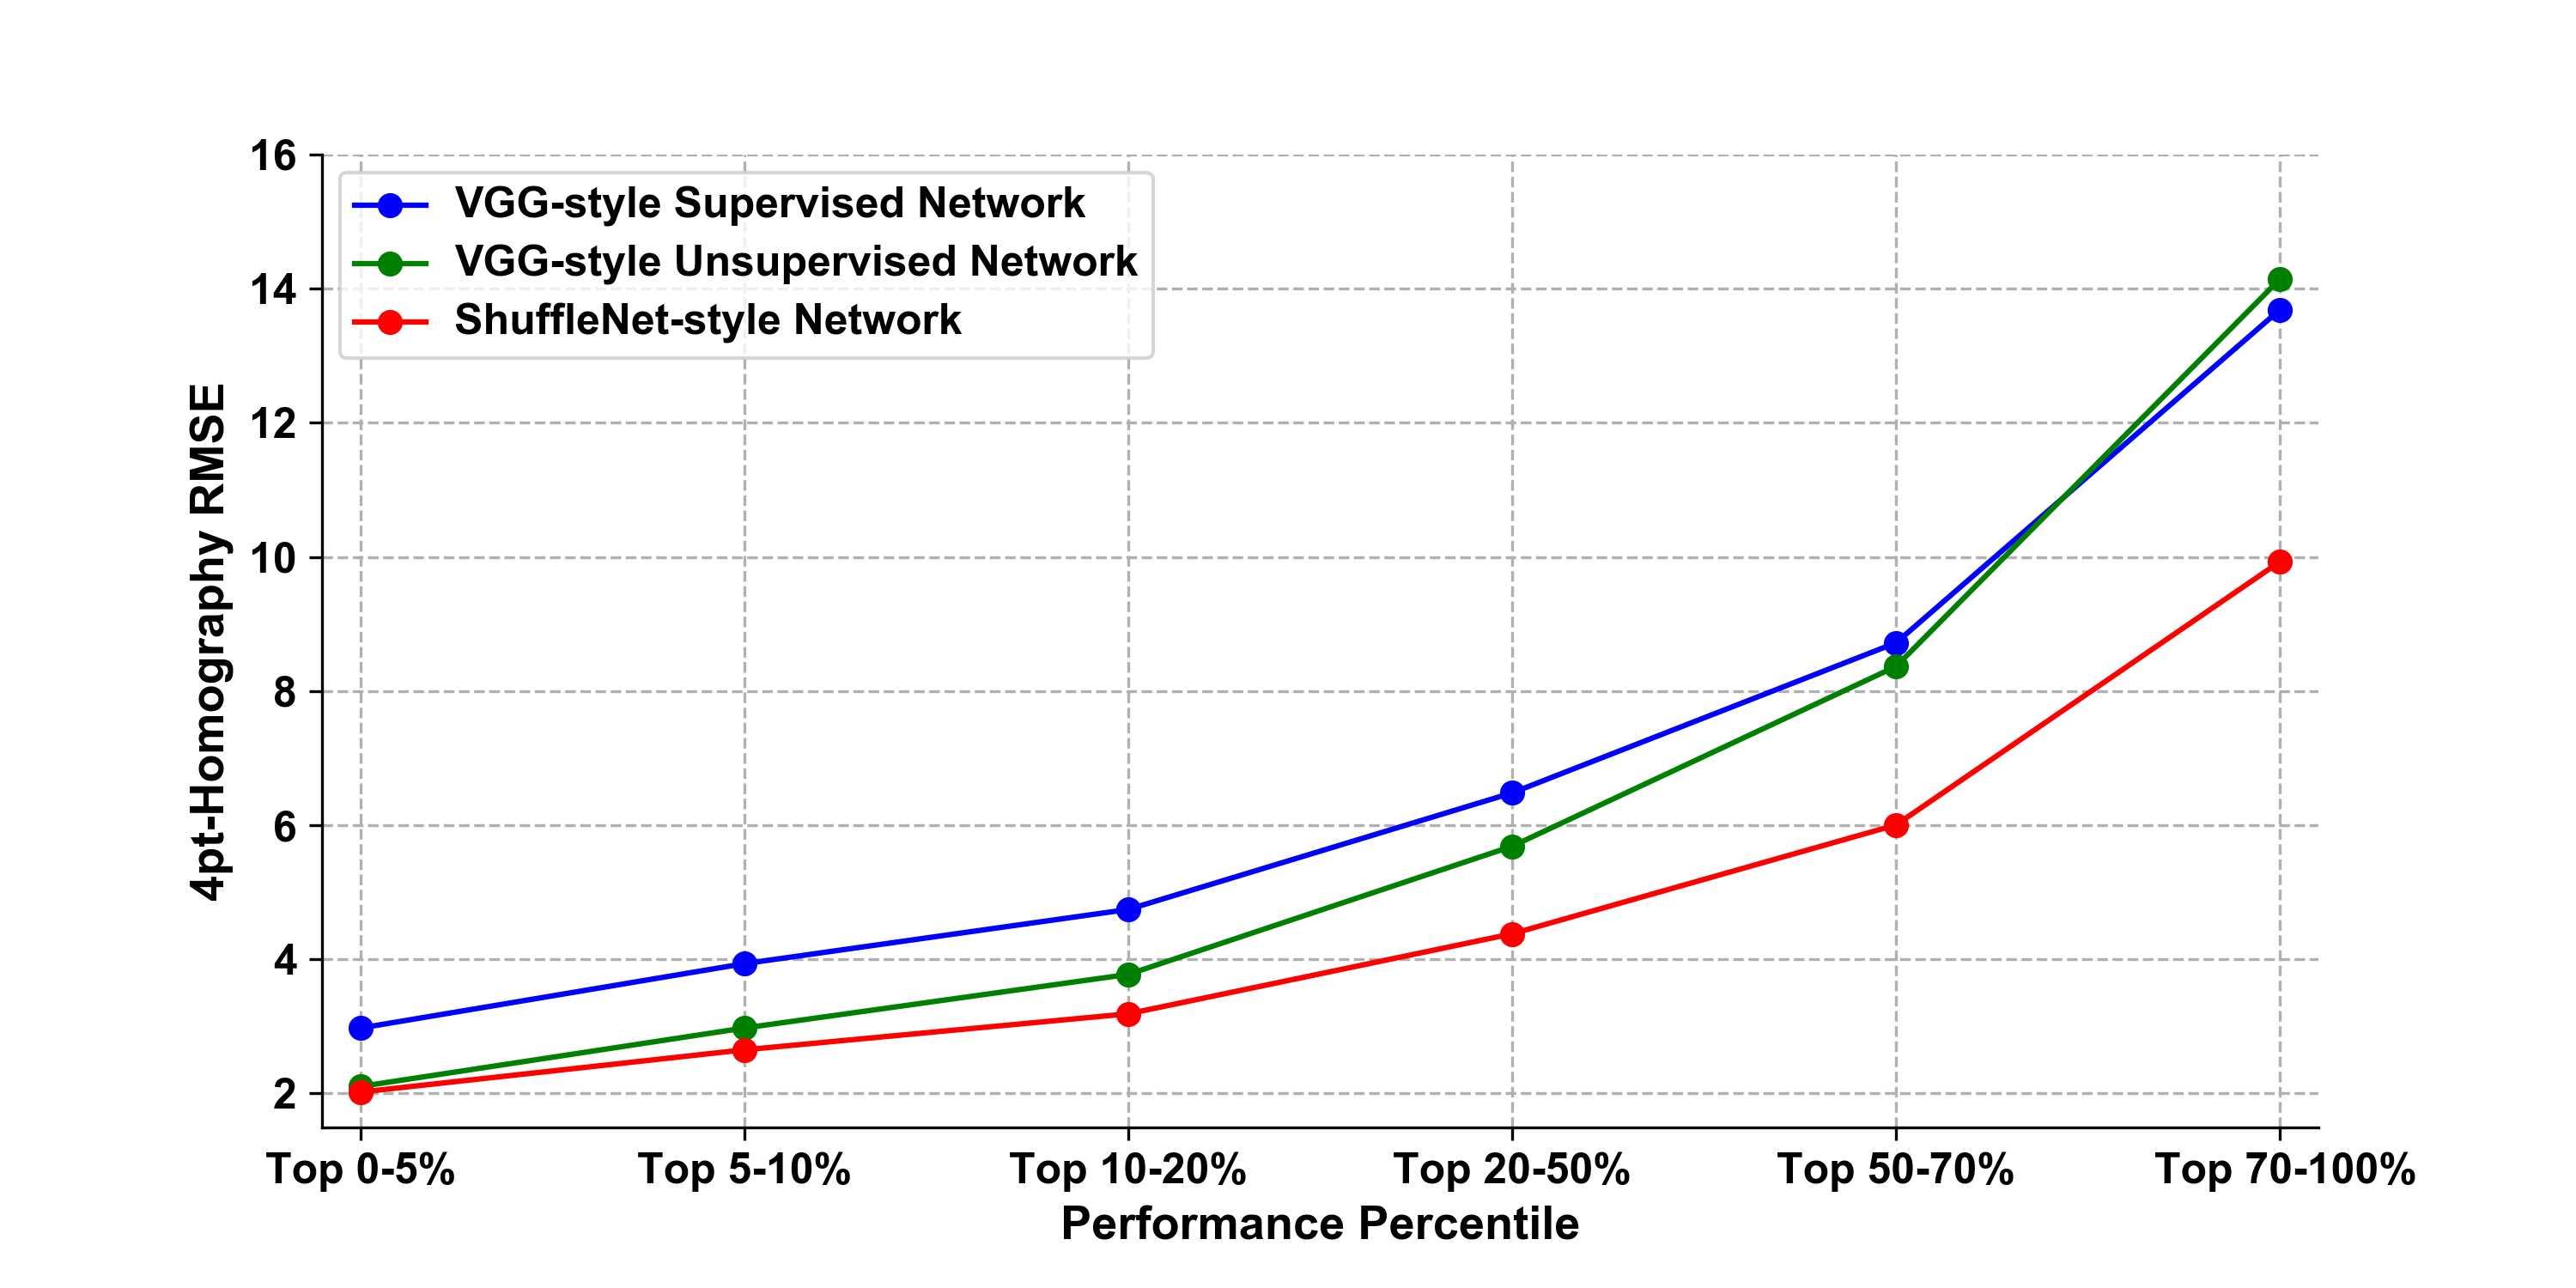
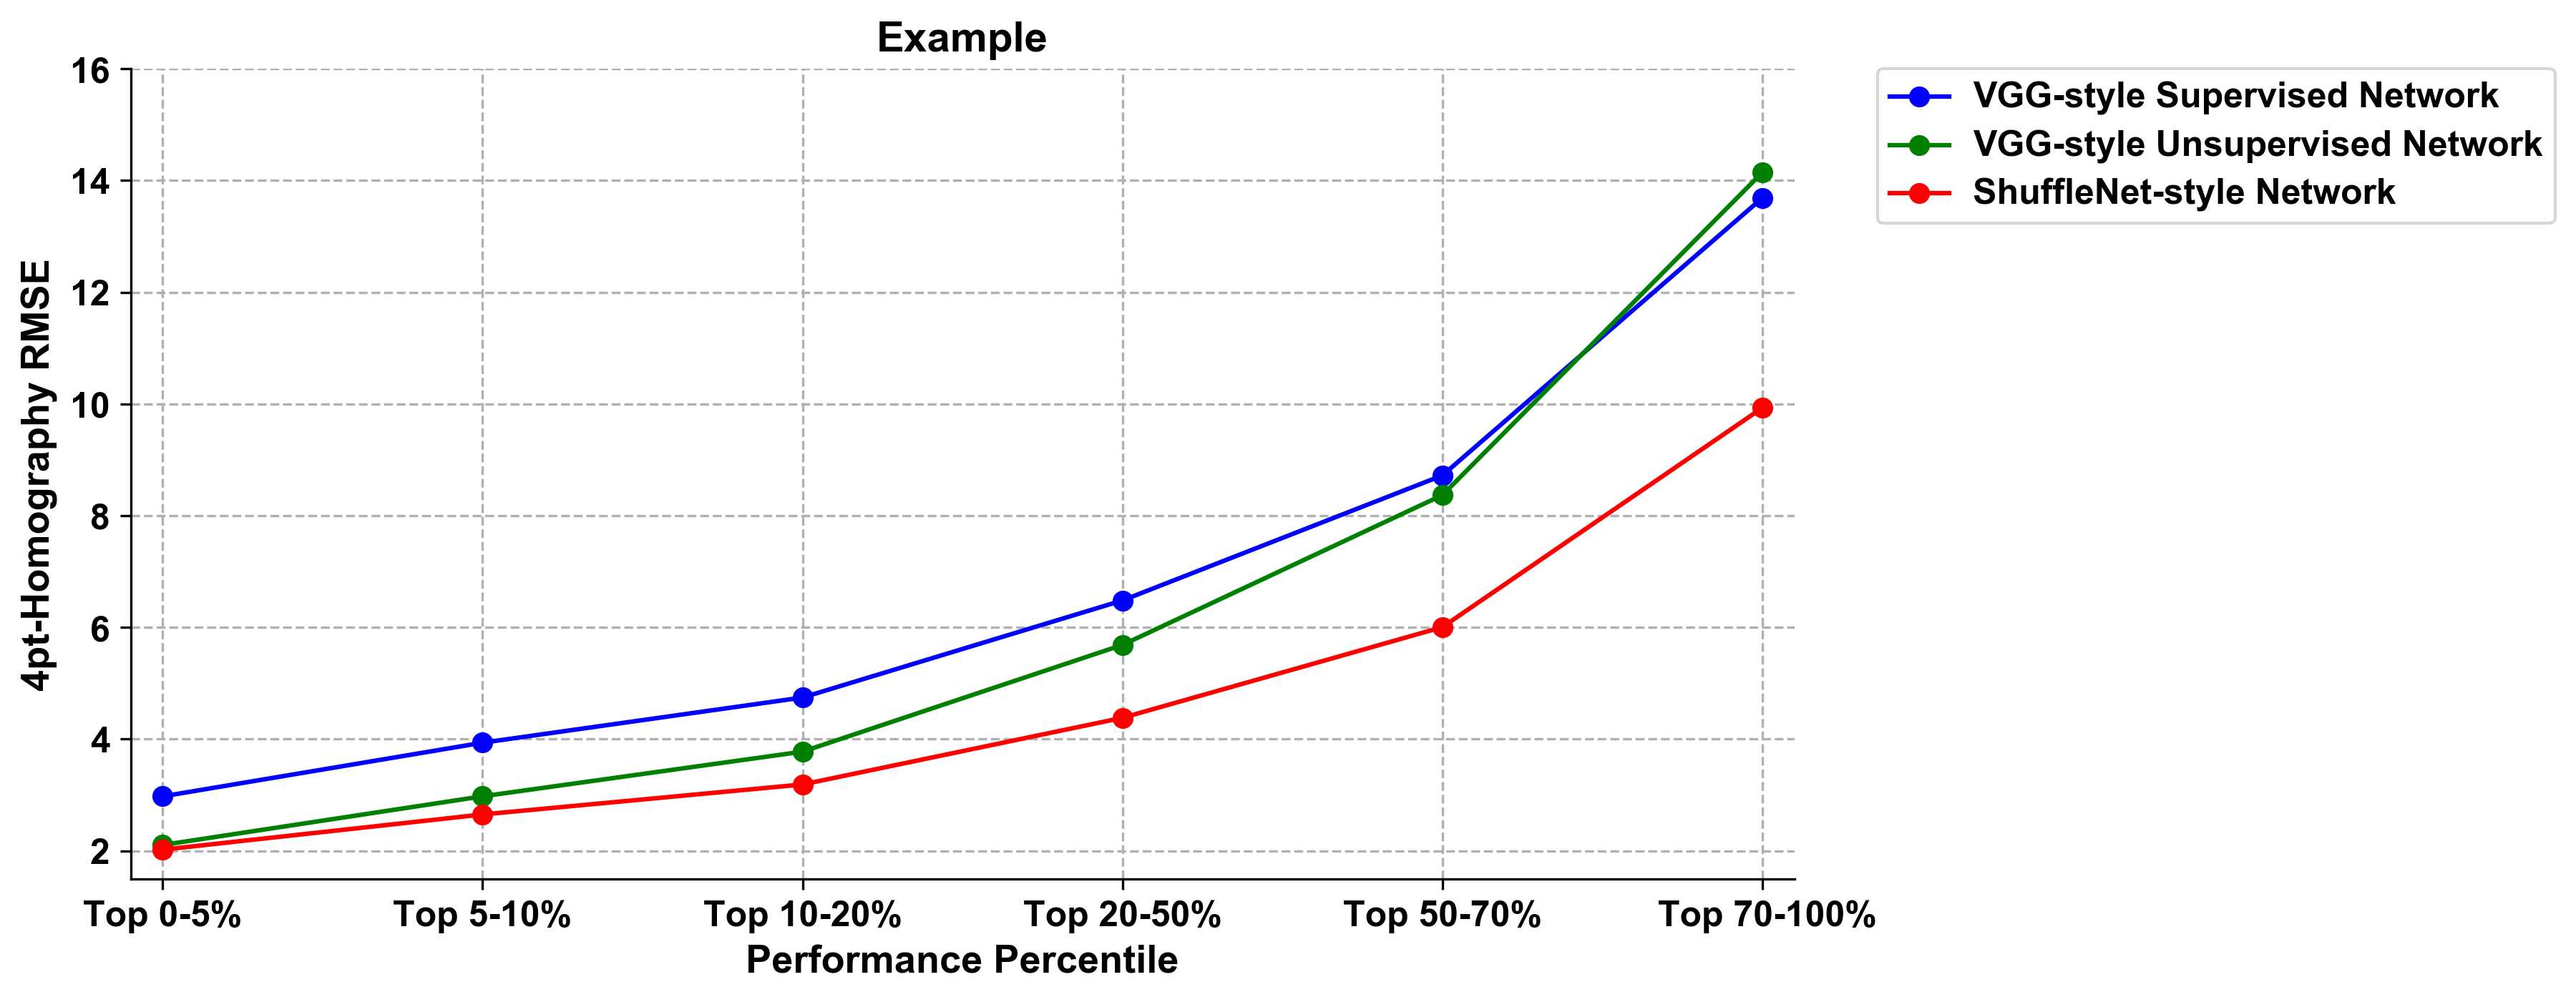
VGG_supervised = np.array([2.9749694, 3.9357018, 4.7440844, 6.482254, 8.720203, 13.687582])
VGG_unsupervised = np.array([2.1044724, 2.9757383, 3.7754183, 5.686206, 8.367847, 14.144531])
ourNetwork = np.array([2.0205495, 2.6509762, 3.1876223, 4.380781, 6.004548, 9.9298])

# label在图示(legend)中显示。若为数学公式,则最好在字符串前后添加"$"符号
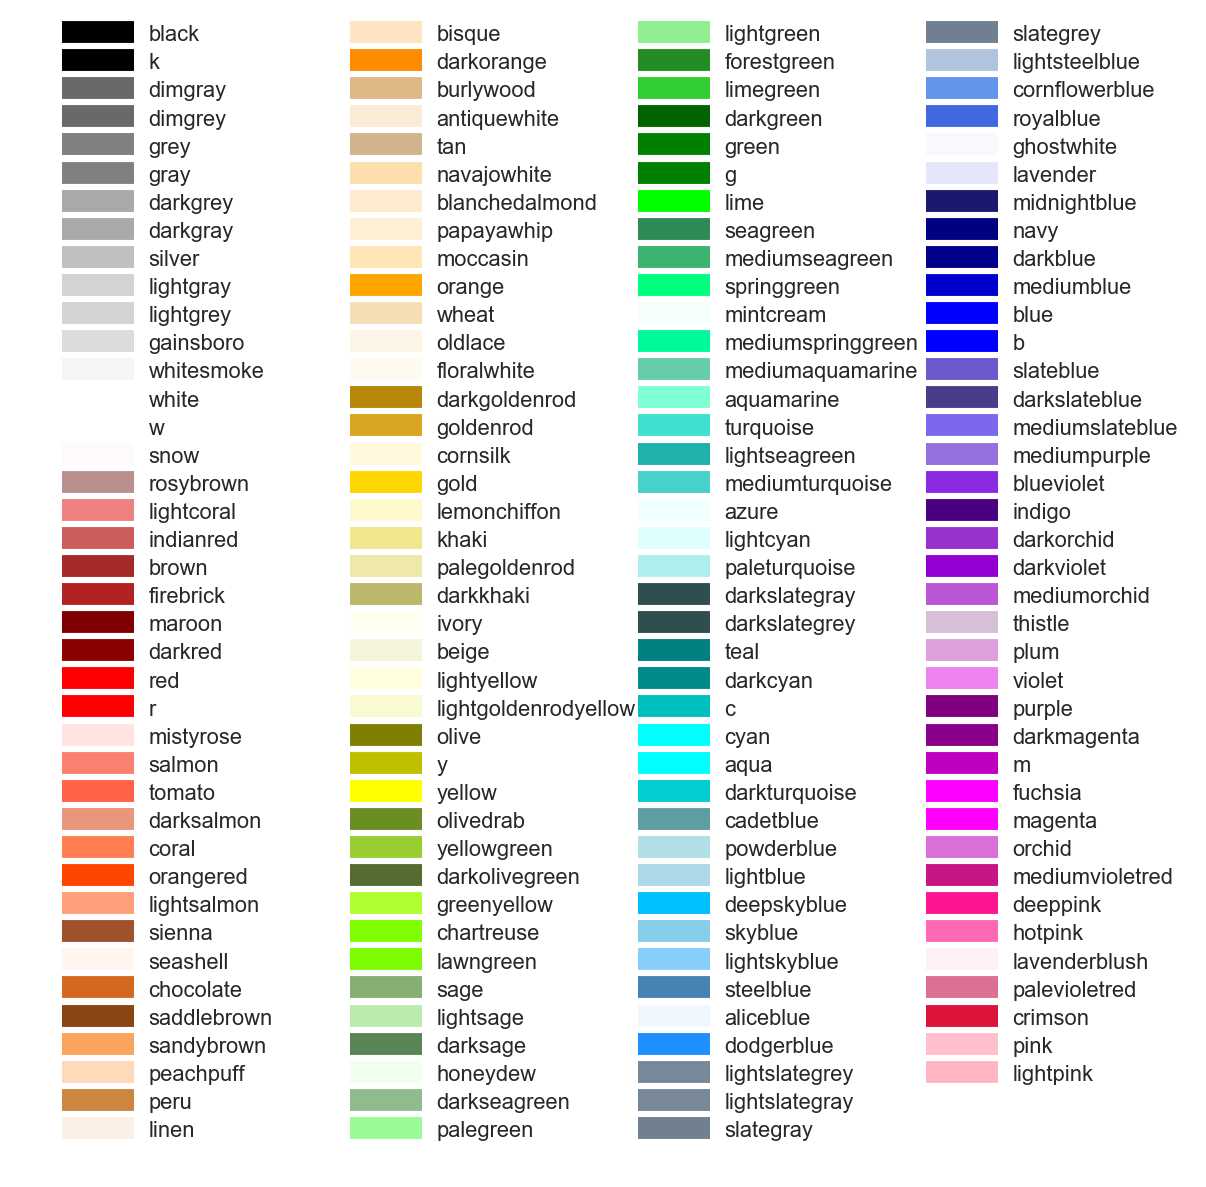
# color:b:blue、g:green、r:red、c:cyan、m:magenta、y:yellow、k:black、w:white、、、
# 线型:-  --   -.  :    ,
# marker:.  ,   o   v    <    *    +    1
plt.figure(figsize=(10, 5))
plt.grid(linestyle="--")  # 设置背景网格线为虚线
ax = plt.gca()
ax.spines[‘top‘].set_visible(False)  # 去掉上边框
ax.spines[‘right‘].set_visible(False)  # 去掉右边框


plt.plot(x, VGG_supervised, marker=‘o‘, color="blue", label="VGG-style Supervised Network", linewidth=1.5)
plt.plot(x, VGG_unsupervised, marker=‘o‘, color="green", label="VGG-style Unsupervised Network", linewidth=1.5)
plt.plot(x, ourNetwork, marker=‘o‘, color="red", label="ShuffleNet-style Network", linewidth=1.5)

# 设置刻度的标识
group_labels = [‘Top 0-5%‘, ‘Top 5-10%‘, ‘Top 10-20%‘, ‘Top 20-50%‘, ‘Top 50-70%‘, ‘ Top 70-100%‘]
plt.xticks(x, group_labels, fontsize=12, fontweight=‘bold‘)  # 默认字体大小为10
plt.yticks(fontsize=12, fontweight=‘bold‘)

# 设置题目和坐标轴名称
plt.title("Example", fontsize=14, fontweight=‘bold‘)  # 默认字体大小为12
plt.xlabel("Performance Percentile", fontsize=13, fontweight=‘bold‘)
plt.ylabel("4pt-Homography RMSE", fontsize=13, fontweight=‘bold‘)
plt.xlim(0.9, 6.1)  # 设置x轴的范围
plt.ylim(1.5, 16)

# 显示各曲线的图例
# plt.legend()
plt.legend(bbox_to_anchor=(1.05, 1), loc=2, borderaxespad=0)
# plt.legend(loc=0, numpoints=1)
leg = plt.gca().get_legend()
ltext = leg.get_texts()
plt.setp(ltext, fontsize=12, fontweight=‘bold‘)  # 设置图例字体的大小和粗细

plt.savefig(‘./filename.svg‘, format=‘svg‘)  # 建议保存为svg格式,再用inkscape转为矢量图emf后插入word中
# plt.savefig(‘./filename.png‘, format=‘png‘, dpi=300)
plt.show()
matplotlib直接存储为矢量格式会有一些问题,最好先存为svg,再转换成emf矢量格式。
在线转换SVG to EMF

图例画在外面,要修改两个地方:
plt.legend(bbox_to_anchor=(1.05, 1), loc=2, borderaxespad=0) # 设置borderaxespad=0是让图例和顶端对齐,不设置则会偏下一点

plt.savefig(‘./filename.png‘, format=‘png‘, dpi=300, bbox_inches=‘tight‘)

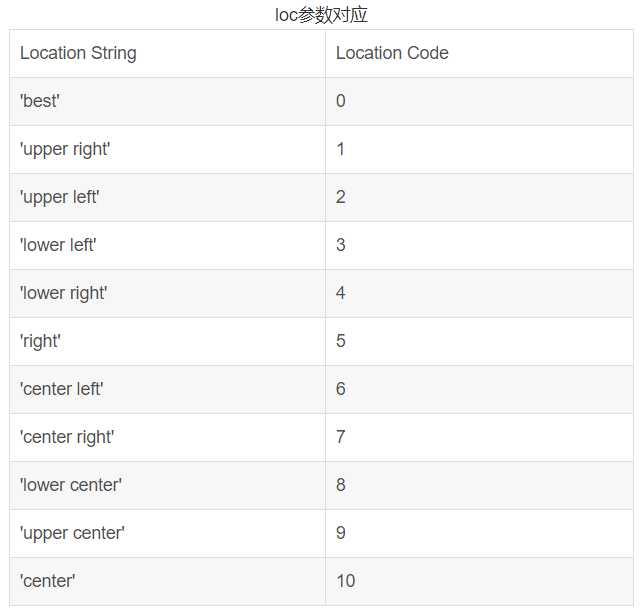
loc位置参数表:

颜色对照表:

原文链接:https://blog.csdn.net/bskfnvjtlyzmv867/java/article/details/80352891
以上是关于matplotlib画图的主要内容,如果未能解决你的问题,请参考以下文章