学好机器学习必会的统计学知识(第二篇)
Posted Xurtle
tags:
篇首语:本文由小常识网(cha138.com)小编为大家整理,主要介绍了学好机器学习必会的统计学知识(第二篇)相关的知识,希望对你有一定的参考价值。
引言
在机器学习应用中,我们不可能离开数据。没有了数据,机器学习算法就像没有了灵魂。更好地理解数据,可以使我们把它更好地应用在机器学习上。在这篇文章中,我会介绍一些在统计学中,理解数据的一些重要概念,从而使大家更准确地操作数据,玩转数据。
注意:在这篇文章中会涉及到很多名词和定义,我就直接用英文了,因为这更加容易理解,翻译成汉语以后会让人更加混乱了。
Populations and Parameters
A population is any large collection of objects or individuals, such as Americans, students, or trees about which information is desired.
A parameter is any summary number, like an average or percentage, that describes the entire population.
下面,我举个例子来说明Populations and Parameters.
- 我们想要知道中国所有男人体重的平均值( μ )。这里,population是所有的中国男人,而parameter是体重的平均值。
我们想要知道中国所有大学生吸烟的比例( p )。这里,population是所有的中国大学生,而parameter是吸烟比例。
但不幸的是,我们几乎不可能知道population的parameter. 对于上面的那个例子来说,我们不可能去调查所有中国男人的体重,然后去求平均值。因此,我们只能去估算population的parameter.
Samples and statistics
A sample is a representative group drawn from the population.
A statistic is any summary number, like an average or percentage, that describes the sample.
还用上面的例子来说明问题。
- 这回我们只选择具有代表性的100个中国男人,求出他们的平均值
x¯ . 从而来估计 μ . 这回我们只选择具有代表性的100个大学生,求出他们吸烟的比例 (̂ p) , 从而来估计 p .
上面的100个大学生就是一个sample,求出的
p̂ 就是sample的一个statistic.因为sample的大小是可控的,因此我们能计算它的任何一个statistic. 从而我们用这个sample statistic去估算未知的population parameter.
有两种方式可以估算population parameter,它们分别是Confidence intervals 和 hypothesis tests. 下面,我来分别介绍这两种方法。
t-based Confidence Interval for the Mean
我们可以用t-interval来估算population mean μ . 下面,我来给出它的定义:
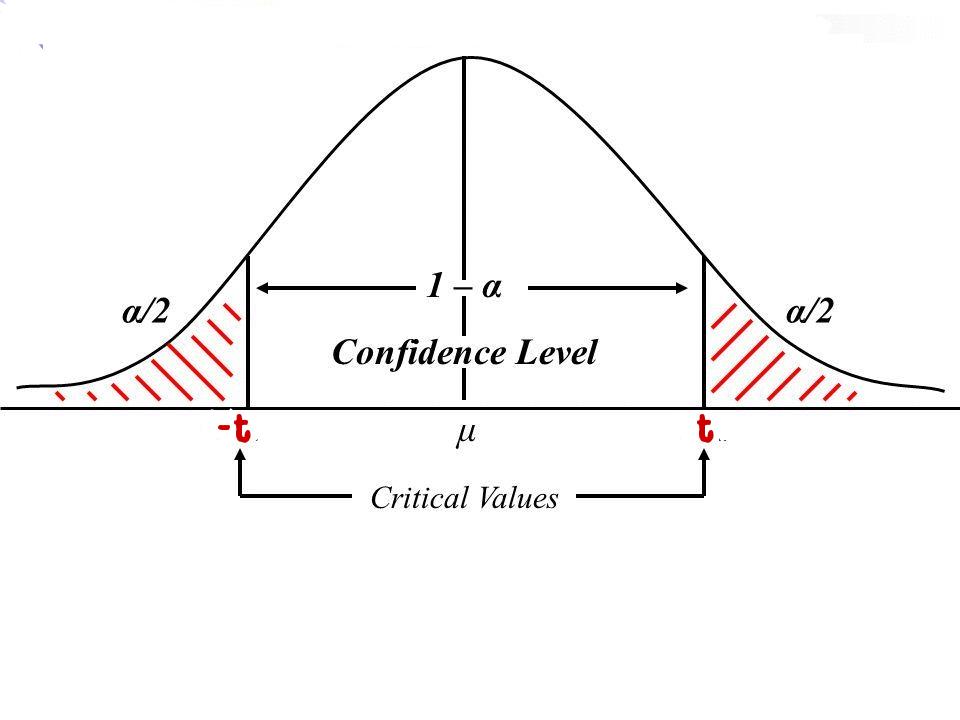
When the population standard deviation σ is not known, an interval estimate for the population mean μ with confidence level 1−α is given by :
x¯±tα/2,n−1(sn‾√)
-
tα/2,n−1:
它取决于sample size
n
通过计算
n−1 , 即degrees of freedom. 也取决于confidence level (1−α)∗100 , 通过求出 α2 。 sn√: 这个整体叫做”standard error“. 它实际上就是 estimated standard deviation of all the possible sample means.
很明显,sample mean x¯ 和 sample standard deviation s 以及sample size
n 都可以很容易从sample data中获得。现在,我们只需要求出 tα/2,n−1 就行了。

要想求出
t
值,我们可以查询T-Table或用一些统计软件。但前提是我们要给出degrees of freedom 和
现在,我们定义confidence level为90%,因此 α/2 为0.05. 假设我们的sample size为15,因此degrees of freedom为15 - 1 = 14. 通过查询T-Table,我们的 t0.05,14=1.761 . 那么现在,如果给定你sample data,我们就可以求出Confidence Interval了。这里,我就不给出数据集了。假设我们求出的区间为(3.43, 3.68),这说明我们有90%的自信population mean在这个区间内。
影响t-interval宽度的因素
通过对上面公式的变换,我们可以得出区间的宽度为:
Width =2×tα/2,n−1(sn‾√)
通过这个公式,我们就可以找出影响宽度的因素了。
- 随着sample mean增加,宽度不变。也就是说,sample mean并不影响区间的宽度。
- 随着sample standard deviation s 减少,区间的宽度减小。
- 随着我们减小confidence level,t值减小,因此区间宽度减小。
- 随着我们增加sample size,区间宽度减小。这是一个我们最容易控制的因素,唯一的花费就是我们的时间和金钱。
Hypothesis Testing
hypothesis testing一般包括下面3个步骤:
- Making an initial assumption
- Collecting evidence (data).
- Based on the available evidence (data), deciding whether to reject or not reject the initial assumption.
hypothesis testing的两种错误类型:

Type I error: The null hypothesis is rejected when it is true.
Type II error: The null hypothesis is not rejected when it is false.
进行Hypothesis Testing 有两种方法,一种是Critical value 方法,另一种是P-value approach. 下面,我来分别介绍这两种方法。
Hypothesis Testing (Critical value approach)
critical value方法比较observed test statistic和critical value,如果test statistic比critical value更加极端,那么null hypothesis is rejected. 如果test statistic并没有critical value极端,那么null hypothesis is not rejected.
在hypothesis testing中,出现type I error的概率叫做significance level,用
用Critical value方法进行任何一个Hypothesis Testing都包含下面四个步骤:
- 定义null hypotheses 和 alternative hypotheses
- 假设null hypothesis is True, 用sample data计算test statistic. 如果进行的hypothesis test 是针对population mean μ 的,那么计算test statistic的公式为: t∗=x¯−μs/n√
- 找到critical value
- 比较critical value 和 test statistic的大小
Hypothesis Testing (P-value approach)
P-value代表的是一个概率,它假设null hypothesis是True的情况下,在alternative hypothesis方向上出现一个比我们sample data的test statistic更极端的test statistic的概率。如果P-value是小于(或等于) α ,那么null hypothesis is rejected. 如果P-value是大于 α ,那么null hypothesis is not rejected.
用P-value方法进行任何一个Hypothesis Testing都包含下面四个步骤:
- 定义null hypotheses 和 alternative hypotheses
- 假设null hypothesis is True, 用sample data计算test statistic. 如果进行的hypothesis test 是针对population mean μ 的,那么计算test statistic的公式为: t∗=