使用matplotlib,seaborn统计缺失数据可视化
Posted ai-creator
tags:
篇首语:本文由小常识网(cha138.com)小编为大家整理,主要介绍了使用matplotlib,seaborn统计缺失数据可视化相关的知识,希望对你有一定的参考价值。
matplotlib的使用:
step1.创建一个空白的画布,此函数返回fig画布
fig=plt.figure()
step2.创建子图
ax=fig.add_subplot(1,2,1)#意思是将画布分为1行2列现在利用第一列返回为第一列的子图
step3.开始画图,此处我们利用seaborn来画,它是matplotlib的高级封装,它不需要指定画布,它是在上一步中指定的画布的画图,参数为x,y
sns.barplot(missing[col], missing.index)
step4.ax可以让我们方便的操作子图,我们设置子图的标题,其中的f表示其内部存在参数,在此处为col它使用{}括起来,使变量可以显示在图中
ax.set_title(f‘Missing values on each columns({col})‘)
step5.最后显示图 fig.show()不显示图像目前原因不知道。
plt.show()
step6.若想保存图像
plt.savefig("1.png")
本次例子使用的是kaggle的一个练习
https://www.kaggle.com/c/cat-in-the-dat-ii
参考https://www.kaggle.com/warkingleo2000/first-step-on-kaggle/data
完整的代码展示,有两种做法第一种做法是参考的https://zhuanlan.zhihu.com/p/93423829
import pandas as pd
import matplotlib.pyplot as plt
import seaborn as sns
def plot_missing_values(df):
    cols = df.columns
    count = [df[col].isnull().sum() for col in cols]#注意此处知识点,同时注意isnull()用法。
    percent = [i / len(df) for i in count]#此处
    missing = pd.DataFrame({‘number‘: count, ‘proportion‘: percent}, index=cols)#注意如何构建dataframe

    fig= plt.figure( figsize=(20, 7))

    for i, col in enumerate(missing.columns):
        ax=fig.add_subplot(1,2,i+1)
        ax.set_title(f‘Missing values on each columns({col})‘)
        sns.barplot(missing[col], missing.index)


    plt.show()

if __name__ == ‘__main__‘:
    raw_train=pd.read_csv("train.csv")
    raw_test=pd.read_csv("test.csv")
    plot_missing_values(raw_train)
    #plt.savefig("1.png")
    plot_missing_values(raw_test)
    #plt.savefig("2.png")
第二种做法参考kaggle https://www.kaggle.com/warkingleo2000/first-step-on-kaggle/data
def plot_missing_values(df):

    cols = df.columns
    count = [df[col].isnull().sum() for col in cols]
    percent = [i/len(df) for i in count]
    missing = pd.DataFrame({‘number‘:count, ‘proportion‘: percent}, index=cols)

    fig, ax = plt.subplots(1,2, figsize=(20,7))
    for i, col in enumerate(missing.columns):

        plt.subplot(1,2,i+1)
        plt.title(f‘Missing values on each columns({col})‘)
        sns.barplot(missing[col], missing.index)
        mean = np.mean(missing[col])
        std = np.std(missing[col])
        plt.ylabel(‘Columns‘)
        plt.plot([], [], ‘ ‘, label=f‘Average {col} of missing values: {mean:.2f} u00B1 {std:.2f}‘)
        plt.legend()
    plt.show()
    return missing.sort_values(by=‘number‘, ascending=False)
分析所画图形:
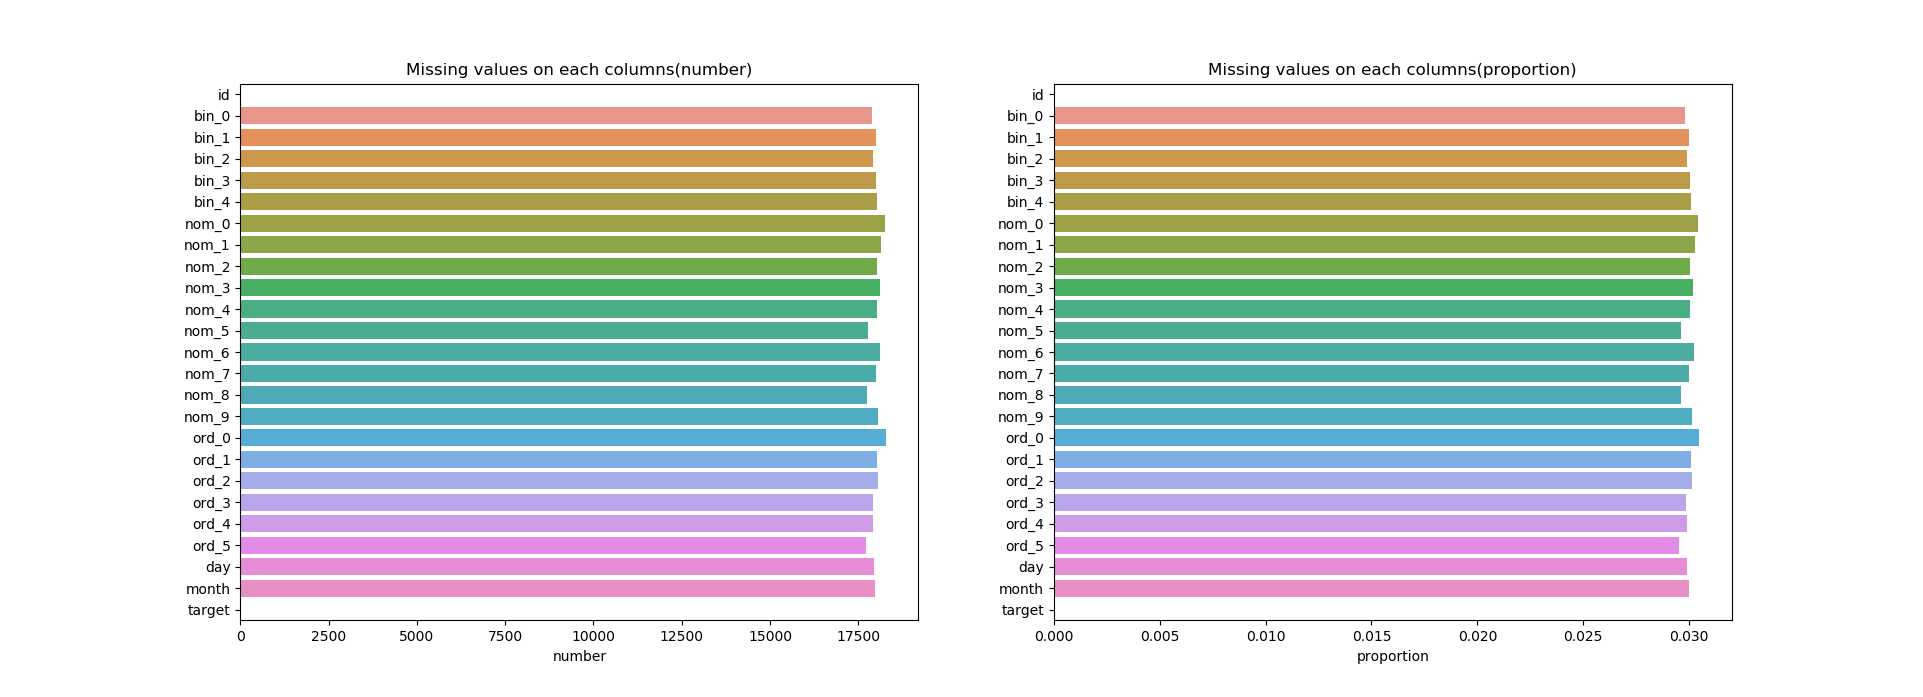
train数据

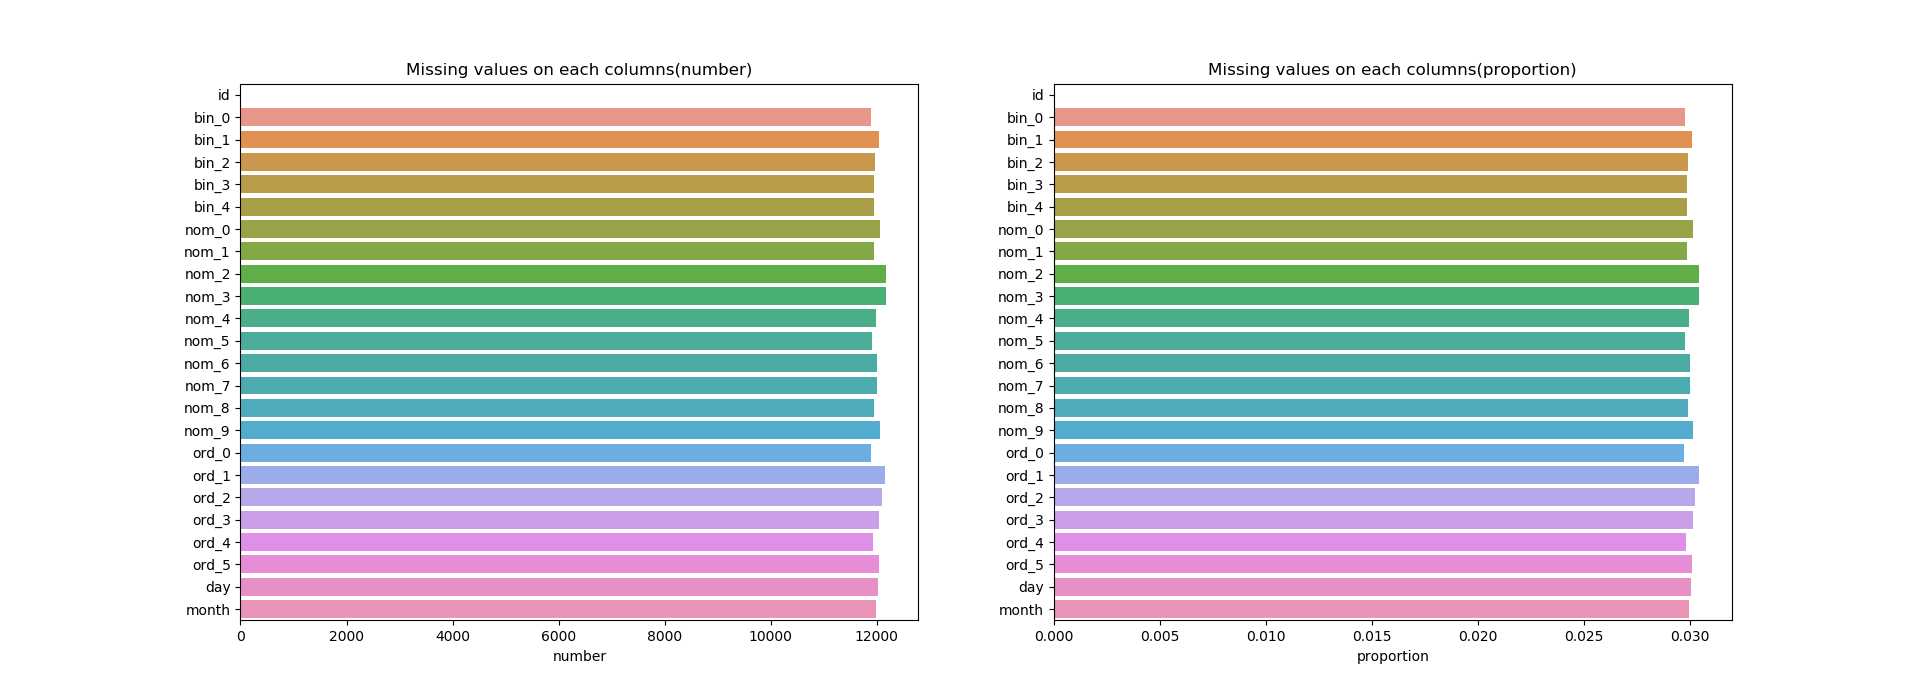
test数据
从上面两张图中我们可以看到不论是训练数据还是测试的数据在每个特征中缺失所占比例很少,都在0.0x的范围之中。
以上是关于使用matplotlib,seaborn统计缺失数据可视化的主要内容,如果未能解决你的问题,请参考以下文章