canvas 根据数组生成柱状图
Posted ltfxy
tags:
篇首语:本文由小常识网(cha138.com)小编为大家整理,主要介绍了canvas 根据数组生成柱状图相关的知识,希望对你有一定的参考价值。
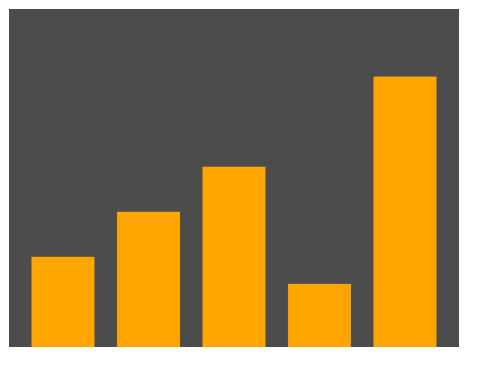
canvas柱状图
 var arr = [
            { id: 1001, price: 100 },
            { id: 1002, price: 150 },
            { id: 1003, price: 200 },
            { id: 1004, price: 70 },
            { id: 1005, price: 300 }
        ];
        var gap = 20;
        var canvas = document.querySelector("canvas");
        var ctx;
        init();
        function init() {
            canvas.width = 400;
            canvas.height = 300;
            ctx = canvas.getContext("2d");
            var max = arr.reduce((value, item) => {
                return value < item.price ? item.price : value;
            }, arr[0].price);
            //max高为300的4/5,其他的高为:300*(4/5)/(max) * h   maxh:240 = othersh: ?   ? = 240
            var scaleHeight = 300 * 4 / 5 / max;
            //每个柱状图的宽为总宽-间隙宽除个数
            var width = (400 - (gap * (arr.length + 1))) / arr.length;
            createChart(width, scaleHeight);
        }

        function createChart(w, hs) {
            ctx.fillStyle = "rgba(0,0,0,0.7)";
            ctx.fillRect(0, 0, 400, 300);
            var x = 0;
            for (var i = 0; i < arr.length; i++) {
                x += gap;
                ctx.fillStyle = "orange";
                var h = hs * arr[i].price;
                ctx.fillRect(x, 300 - h, w, h);
                x += w;
            }
        }
效果:

以上是关于canvas 根据数组生成柱状图的主要内容,如果未能解决你的问题,请参考以下文章