perf-tools 简单试用
Posted rongfengliang
tags:
篇首语:本文由小常识网(cha138.com)小编为大家整理,主要介绍了perf-tools 简单试用相关的知识,希望对你有一定的参考价值。
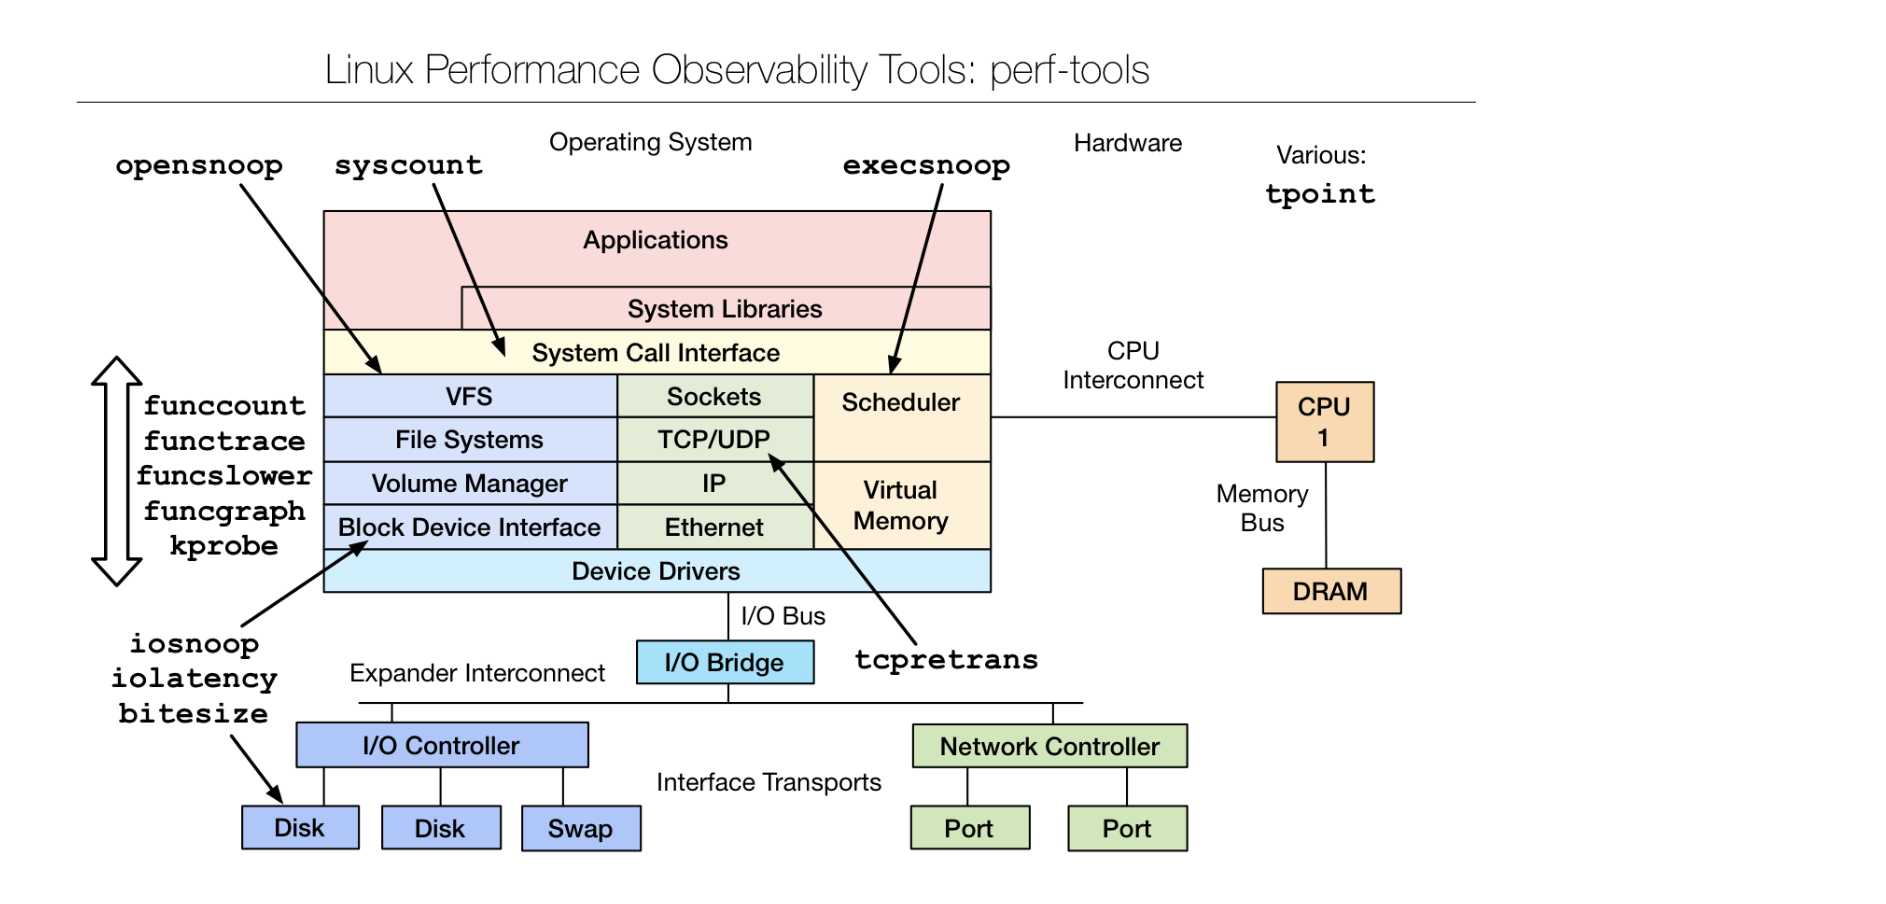
per-tools 是性能优化大师brendan gregg 就有perf 以及ftrace 编写的性能优化工具集
提供了io 、网络、系统调用。。。大部分方面的性能分析工具。
一张参考图
安装
- clone 代码
git clone --depth 1 https://github.com/brendangregg/perf-tools
- 基本使用
查看io 延迟
./iolatency -Q
效果
./iolatency -Q
Tracing block I/O. Output every 1 seconds. Ctrl-C to end.
?
>=(ms) .. <(ms) : I/O |Distribution |
0 -> 1 : 0 | |
1 -> 2 : 0 | |
2 -> 4 : 0 | |
4 -> 8 : 0 | |
8 -> 16 : 2 |######################################|
?
>=(ms) .. <(ms) : I/O |Distribution |
0 -> 1 : 0 | |
?
>=(ms) .. <(ms) : I/O |Distribution |
0 -> 1 : 0 | |
?
>=(ms) .. <(ms) : I/O |Distribution |
0 -> 1 : 0 | |
^C
说明
perf-tools 使用简单,同时github 上也提供了比较全的demo,可以方便学习
参考资料
https://github.com/brendangregg/perf-tools
以上是关于perf-tools 简单试用的主要内容,如果未能解决你的问题,请参考以下文章