matplotlib subplot 多图合一
Posted heguihui
tags:
篇首语:本文由小常识网(cha138.com)小编为大家整理,主要介绍了matplotlib subplot 多图合一相关的知识,希望对你有一定的参考价值。
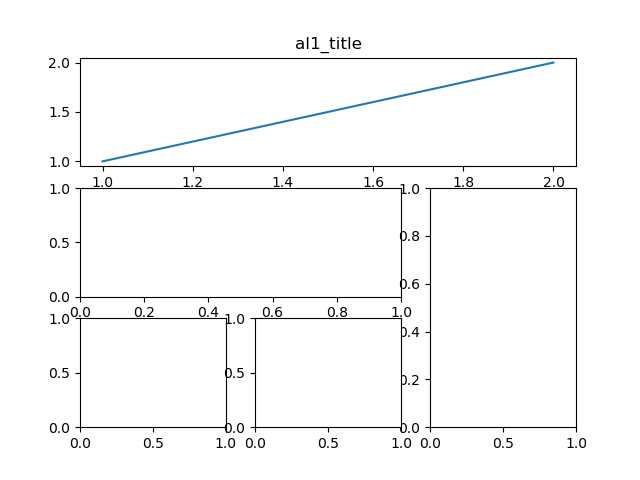
1:第一种方法
# method1: subplot2grid
    #################
    ‘‘‘
    第一个参数(3, 3) 是把图分成3行3列
    第二个参数是位置 (0, 0)表示从0行0列开始
    第三个参数  colspan=3  表示列占3列 ,
    第四个参数 rowspan=1  表示行占一行

    ‘‘‘
    plt.figure()
    ax1 = plt.subplot2grid((3, 3), (0, 0), colspan=3, rowspan=1)
    ax1.plot([1, 2], [1, 2])
    ax1.set_title(‘al1_title‘)
    ax2 = plt.subplot2grid((3, 3), (1, 0), colspan=2,)
    ax3 = plt.subplot2grid((3, 3), (1, 2), rowspan=2)
    ax4 = plt.subplot2grid((3, 3), (2, 0))
    ax5 = plt.subplot2grid((3, 3), (2, 1))

    plt.savefig(‘./image_dir/grid1.png‘)
    plt.show()
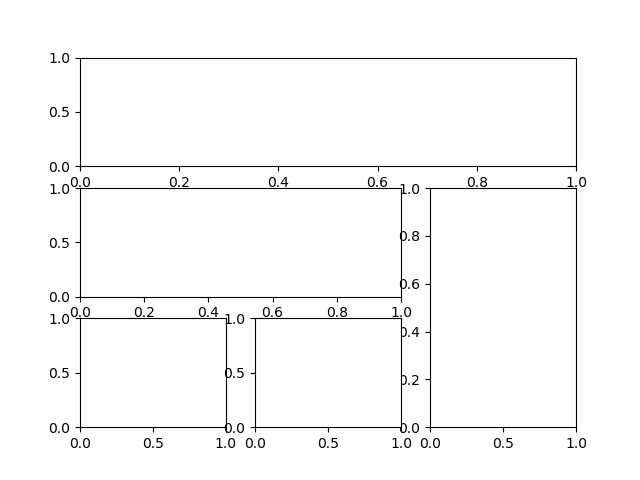
2: 第二种方法:
    import matplotlib.pyplot as plt
    import matplotlib.gridspec as gridspec

    plt.figure()
    gs = gridspec.GridSpec(3, 3)
    ax1 = plt.subplot(gs[0, :])
    ax2 = plt.subplot(gs[1, :2])
    ax3 = plt.subplot(gs[1:, 2])
    ax4 = plt.subplot(gs[-1, 0])
    ax5 = plt.subplot(gs[-1, -2])

    plt.savefig(‘./image_dir/grid2.png‘)
    plt.show()
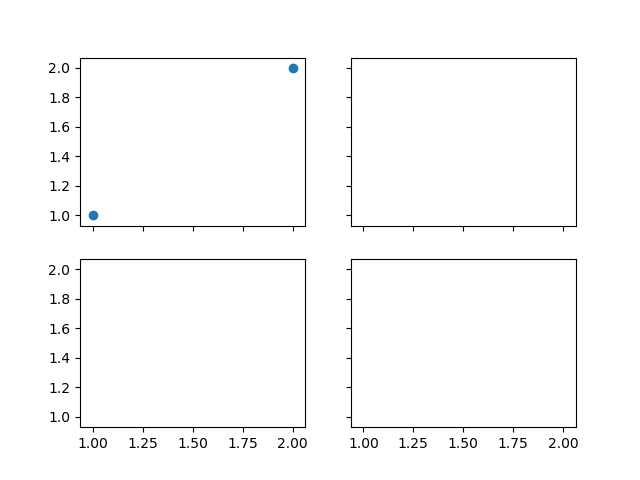
3: 第三种方法
 # method 3 : easy to define structure
    f, ((ax11, ax12), (ax21, ax22)) = plt.subplots(2, 2, sharex=True, sharey=True)
    ax11.scatter([1, 2], [1, 2])
    plt.savefig(‘./image_dir/grid3.png‘)
    plt.tight_layout()
    plt.show()
以上是关于matplotlib subplot 多图合一的主要内容,如果未能解决你的问题,请参考以下文章
matplotlib ----- 多子图, subplots
在 python (Matplotlib) 中使用 subplot 和 imshow 时删除白色边框
matplotlib.pyplot中add_subplot方法参数111的含义
Python可视化matplotlib多子图可视化(Multiple Subplots):plt.axes()plt.subplot()plt.subplots()