MATLAB | 老版本如何更加优雅的调整子图空隙,去除白边?
Posted slandarer
tags:
篇首语:本文由小常识网(cha138.com)小编为大家整理,主要介绍了MATLAB | 老版本如何更加优雅的调整子图空隙,去除白边?相关的知识,希望对你有一定的参考价值。
老版本如何更加优雅的调整子图空隙,去除白边?标题如是说,之所以说是老版本,不是新版本用不了,而是因为比较新的版本的tiledlayout也能实现这些功能,
不过对于用惯了subplot函数的人,这里推出的tsubplot函数可能会更合大家胃口。老样子,先讲用法,工具函数放在最后。
效果

可以看到几乎完全没有白边。
函数使用
函数的基本使用形式为:
- tsubplot(m,n,p,type)
m是网格行数,n是网格列数,p是网格位置这些和subplot一模一样。不同的是type属性可以控制间隙,以下是该属性可取的值:
- ‘tight’ 几乎没有空隙
- ‘compact’ 紧凑
- ‘loose’ 较为松散
基本使用
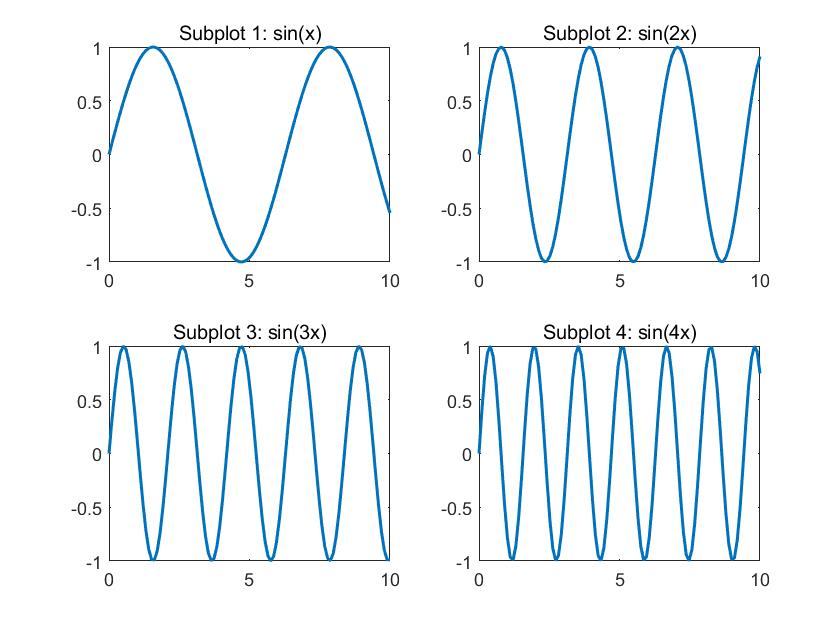
type='tight';

tsubplot(2,2,1,type)
x=linspace(0,10);
y1=sin(x);
plot(x,y1,'LineWidth',1.5)
title('Subplot 1: sin(x)')

tsubplot(2,2,2,type)
y2=sin(2*x);
plot(x,y2,'LineWidth',1.5)
title('Subplot 2: sin(2x)')

tsubplot(2,2,3,type)
y2=sin(3*x);
plot(x,y2,'LineWidth',1.5)
title('Subplot 3: sin(3x)')

tsubplot(2,2,4,type)
y3=sin(4*x);
plot(x,y3,'LineWidth',1.5)
title('Subplot 4: sin(4x)')
'tight’效果:

'compact’效果:

'loose’效果:

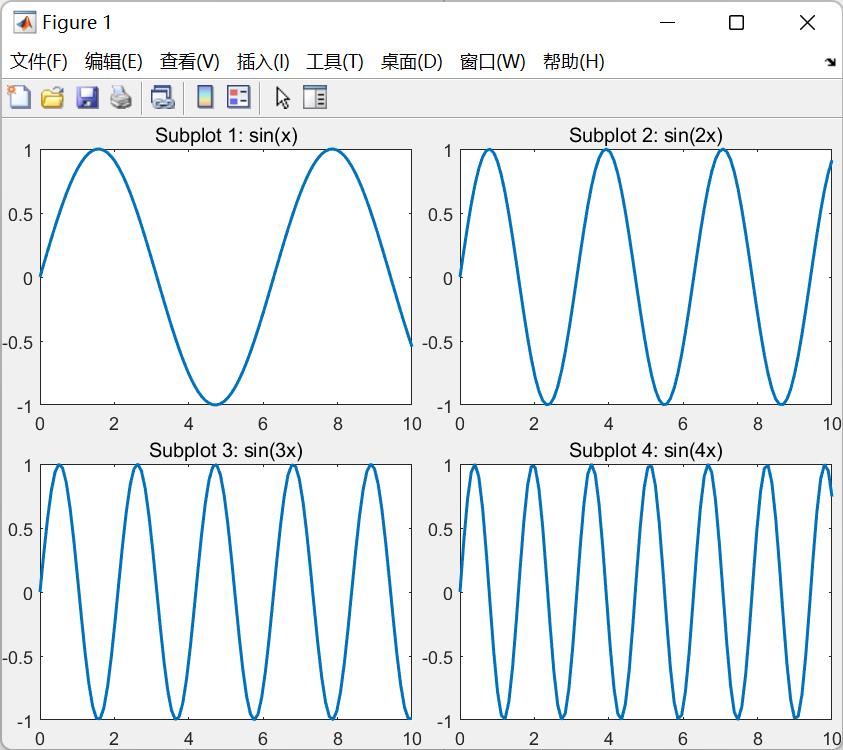
原始效果:
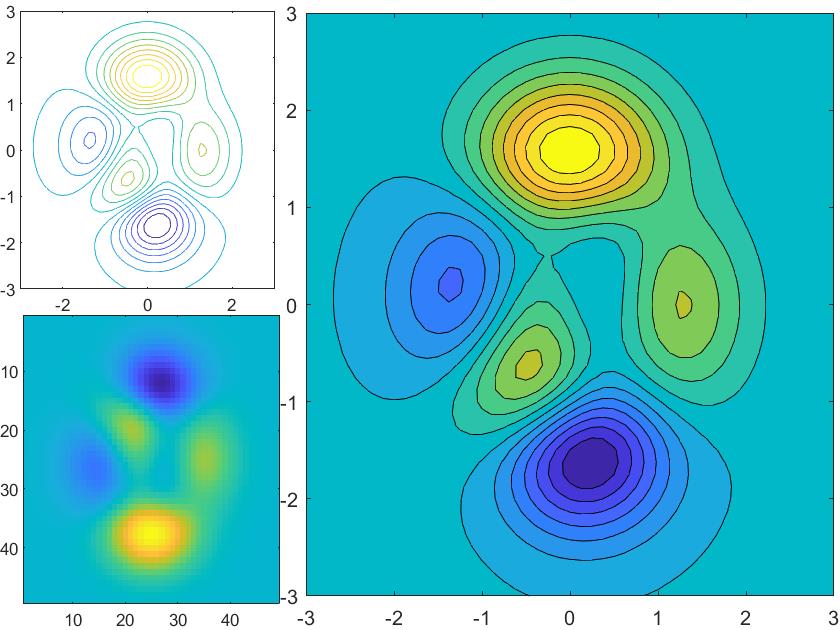
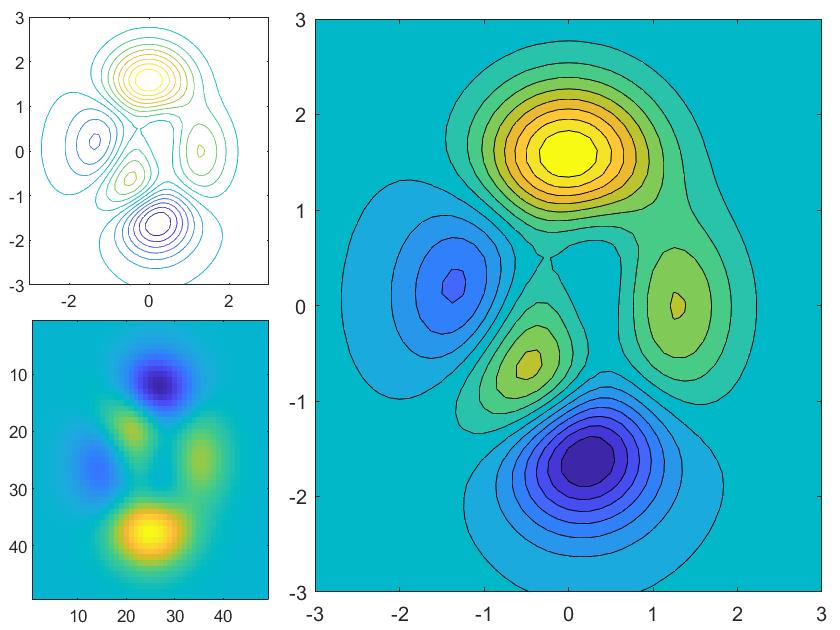
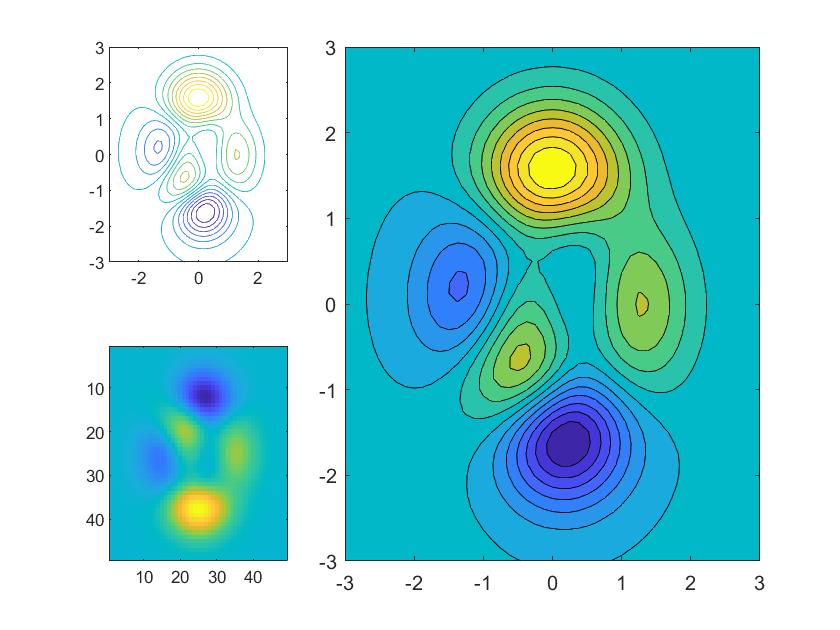
占据多块子图
type='tight';
[X,Y,Z]=peaks;

% 坐标区域块 1
tsubplot(2,3,1,type)
contour(X,Y,Z,15)

% 占据两行两列的坐标区域块
tsubplot(2,3,[2,3,5,6],type)
contourf(X,Y,Z,15)

% 坐标区域块 3
tsubplot(2,3,4,type)
imagesc(Z)
'tight’效果:
'compact’效果:
'loose’效果:

原始效果:
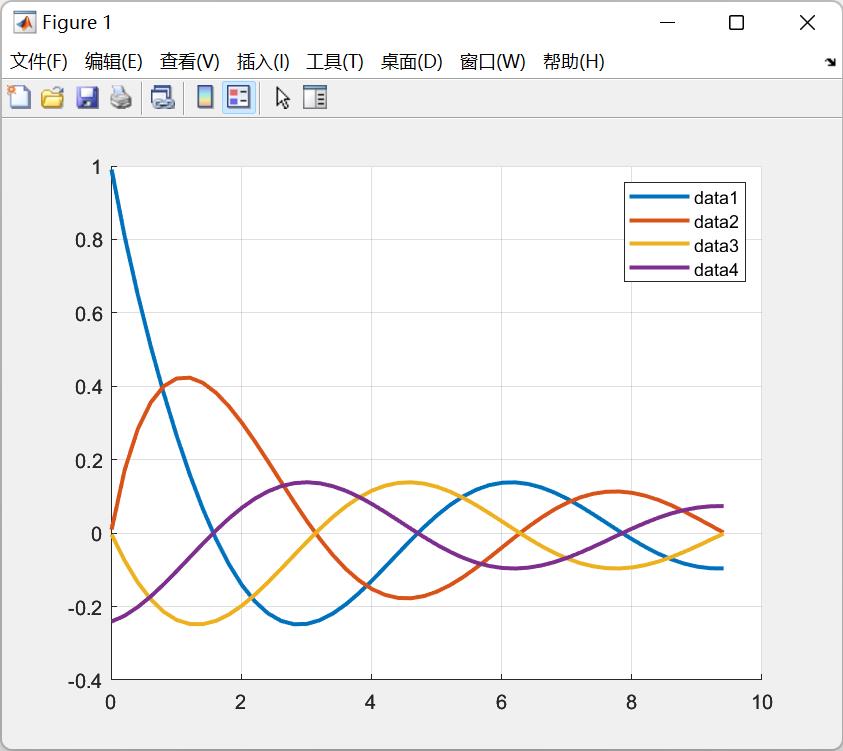
单图
tsubplot(1,1,1,'tight');

t=0.01:0.2:3*pi;
hold on;grid on
plot(t,cos(t)./(1+t),'LineWidth',2)
plot(t,sin(t)./(1+t),'LineWidth',2)
plot(t,cos(t+pi/2)./(1+t+pi/2),'LineWidth',2)
plot(t,cos(t+pi)./(1+t+pi),'LineWidth',2)
legend
'tight’效果:
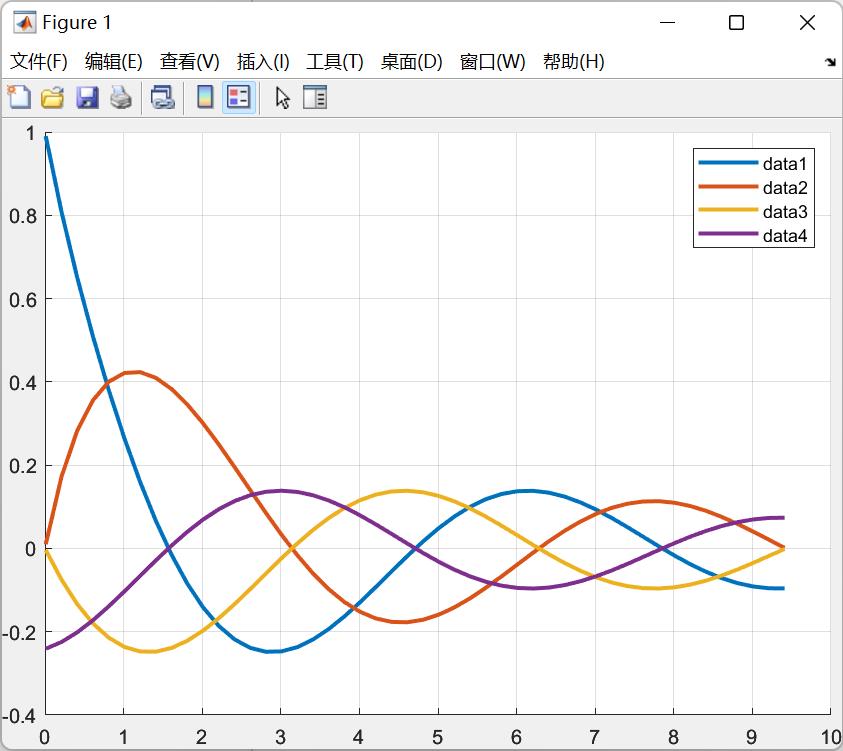
原始效果:
工具函数完整代码
function ax=tsubplot(rows,cols,ind,type)
% @author : slandarer
% gzh  : slandarer随笔

if nargin<4,type='tight';end
sz=[rows,cols];
ratio1=[0,0,1,1];
switch type
    case 'tight'
        ratio1=[0,0,1,1];
        % ratio2=[0.031 0.054 0.9619 0.9254];
    case 'compact'
        ratio1=[0.034 0.0127 0.9256 0.9704];
        % ratio2=[0.065 0.0667 0.8875 0.8958];
    case 'loose'
        ratio1=[0.099 0.056 0.8131 0.8896];
        % ratio2=[0.13 0.11 0.775 0.815];
end
k=1;
posList=zeros(sz(1)*sz(2),4);
for i=1:sz(1)
    for j=1:sz(2)
        tpos=[(j-1)/sz(2),(sz(1)-i)/sz(1),1/sz(2),1/sz(1)];
        posList(k,:)=[tpos(1)+tpos(3).*ratio1(1),tpos(2)+tpos(4).*ratio1(2),...
                      tpos(3).*ratio1(3),tpos(4).*ratio1(4)];
        k=k+1;
    end
end
posSet=posList(ind(:),:);
xmin=min(posSet(:,1));
ymin=min(posSet(:,2));
xmax=max(posSet(:,1)+posSet(:,3));
ymax=max(posSet(:,2)+posSet(:,4));
ax=axes('Parent',gcf,'LooseInset',[0,0,0,0],...
    'OuterPosition',[xmin,ymin,xmax-xmin,ymax-ymin]);
% @author : slandarer
% gzh  : slandarer随笔
end
以上是关于MATLAB | 老版本如何更加优雅的调整子图空隙,去除白边?的主要内容,如果未能解决你的问题,请参考以下文章