MATLAB | 全网唯一,使用MATLAB绘制矩形树状图
Posted slandarer
tags:
篇首语:本文由小常识网(cha138.com)小编为大家整理,主要介绍了MATLAB | 全网唯一,使用MATLAB绘制矩形树状图相关的知识,希望对你有一定的参考价值。
绘制效果

全网唯一这四个字我都快说腻了,请叫我绘图小天才,又双叒叕写了一个工具函数发到了MATHWORKS,矩形树状图主要用于直观展示各个元素的分类和占比。
编写不易点个赞叭~~
基本使用
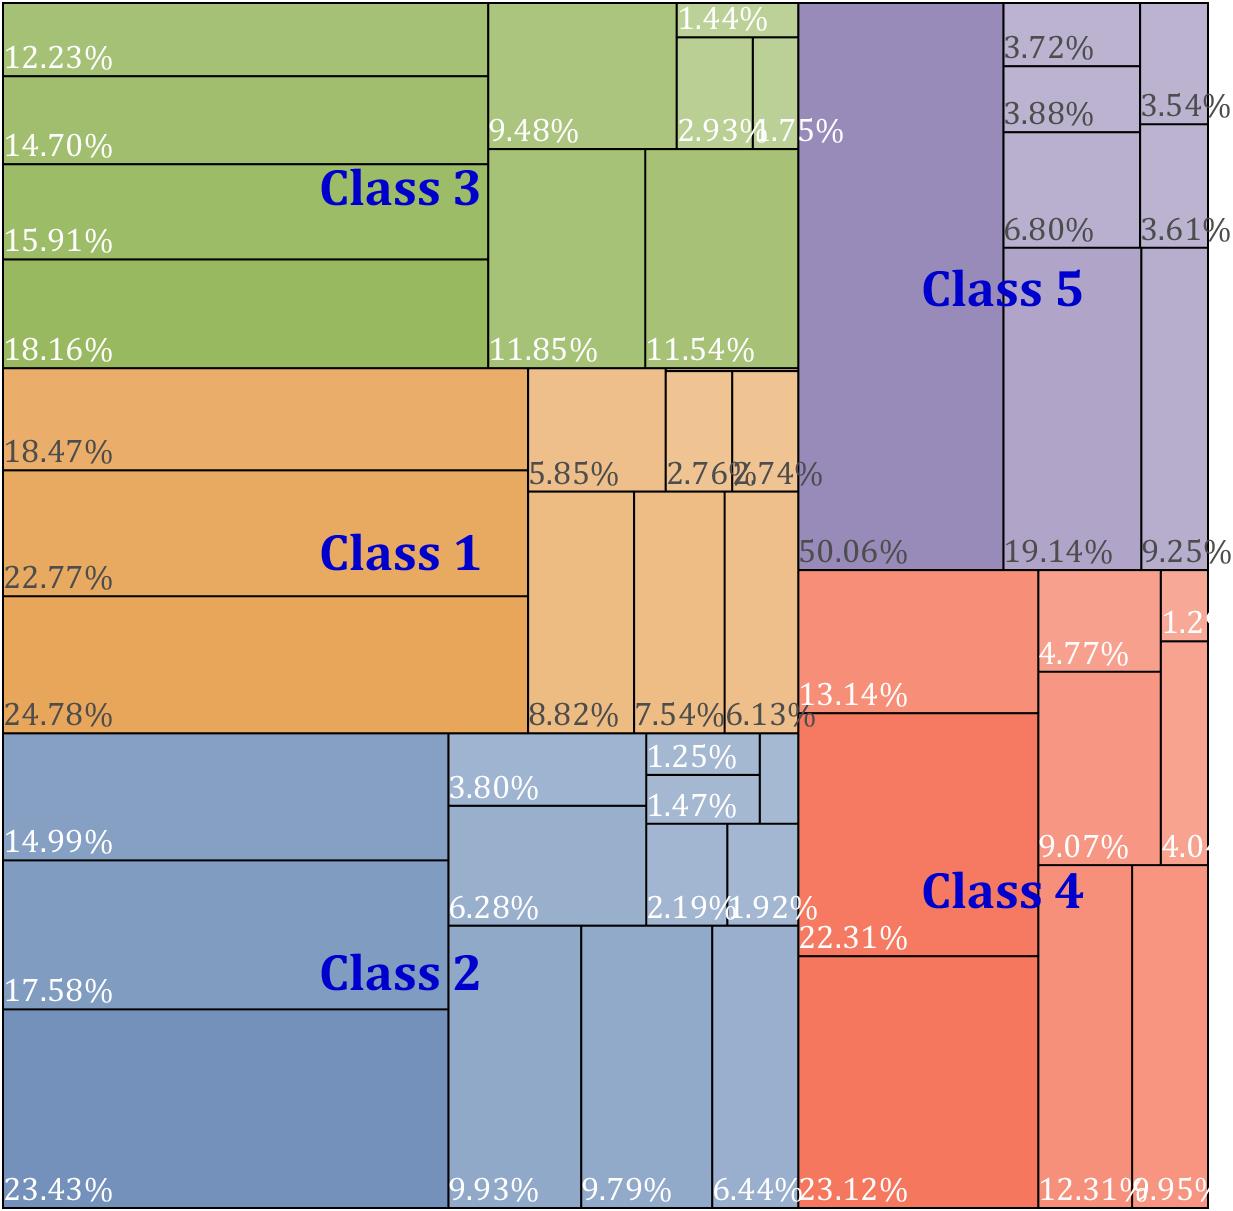
需要准备一组大于0的数据,以及每个数据的分类情况,例如我随即生成50个数据并将其随机分到1-5类中,占比越大的类绘制出来越靠近左下角:
% 随机生成数据及分类
Data=rand(1,50).*linspace(10,100,50);
Class=randi([1,5],[50,1]);
% 绘图
CT=rectTree(Data,Class);
CT=CT.draw();
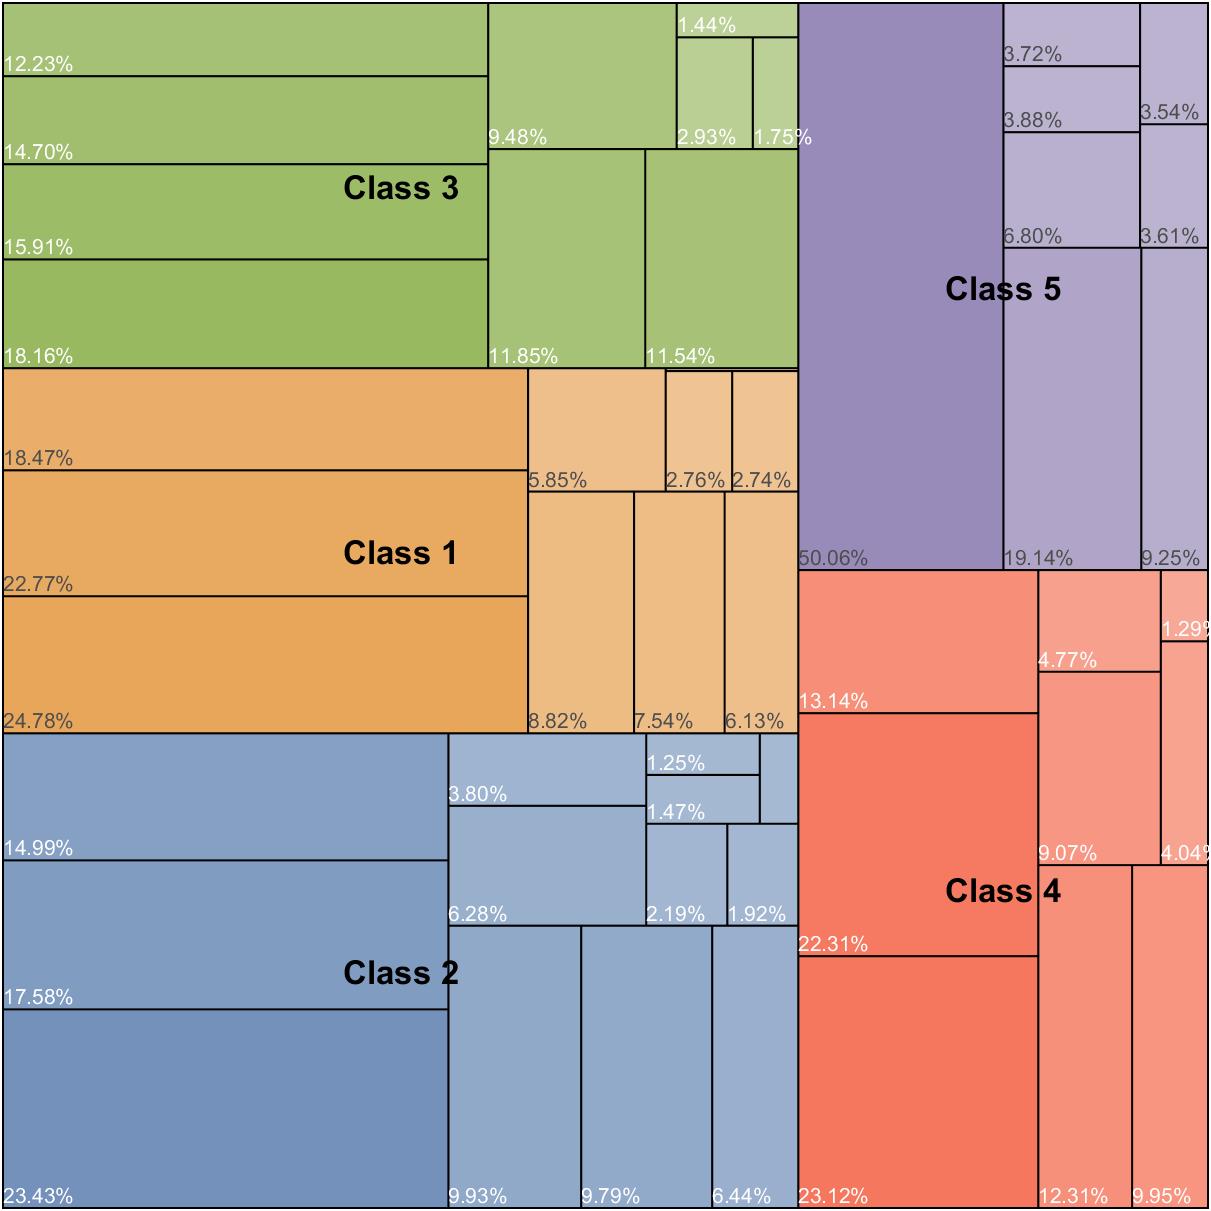
可以看出如果没有特意设置各个类的名字和各个元素的名字,各类就会取名Class n各个元素就会显示占这个类的比例。
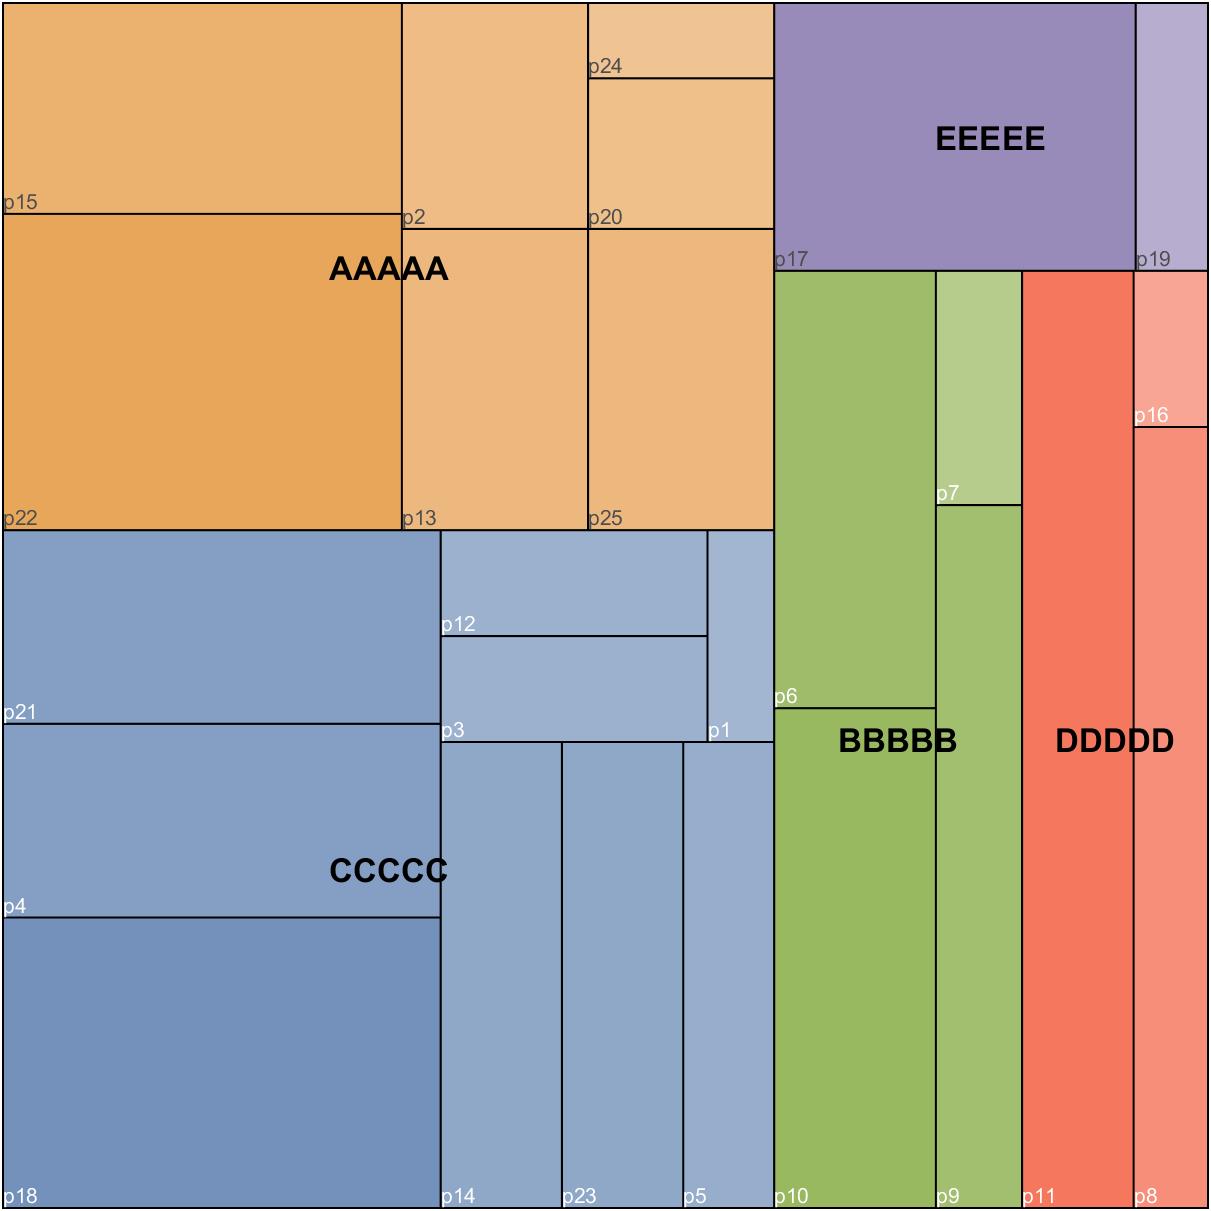
设置类名和元素名
举个实例
Data=[1;3;2;6;3;7;2;5;6;8;9;2;4;4;6;1;5;9;1;2;6;9;4;1;4];
Class=randi([1,5],[25,1]);
for i=1:length(Data)
    Namei=['p',num2str(i)];
end
ClassName='AAAAA','BBBBB','CCCCC','DDDDD','EEEEE';

CT=rectTree(Data,Class,'Name',Name,'ClassName',ClassName);
CT=CT.draw();
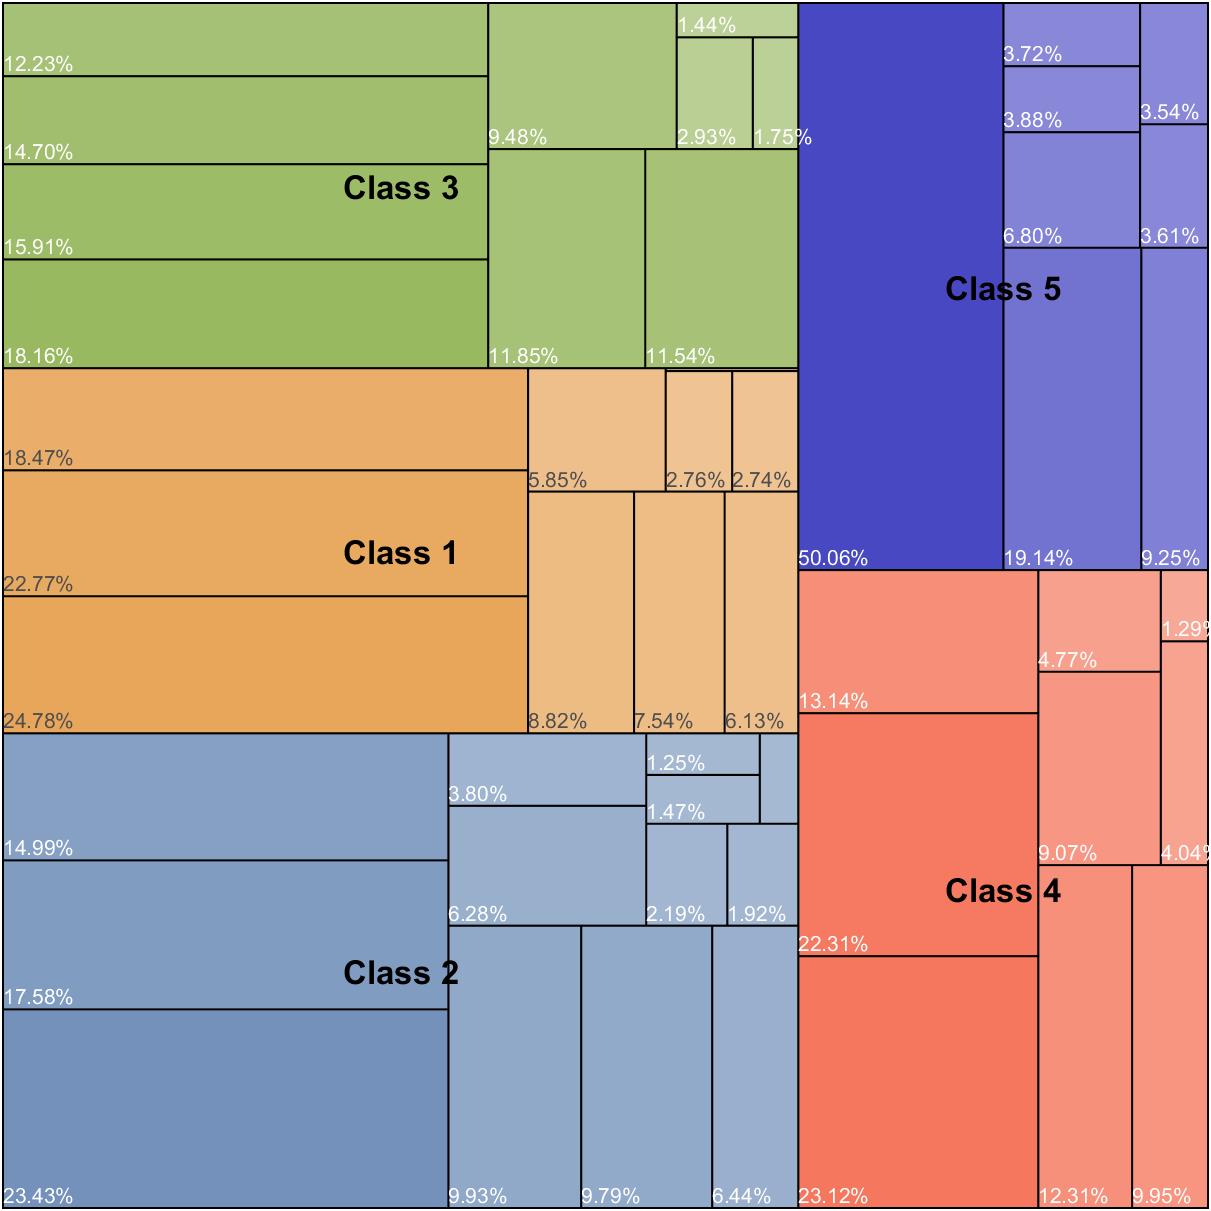
色块颜色设置
使用setColor(N,color)设置每一类的颜色,例如设置第五类为蓝色:
CT.setColor(5,[.1,.1,.7]);
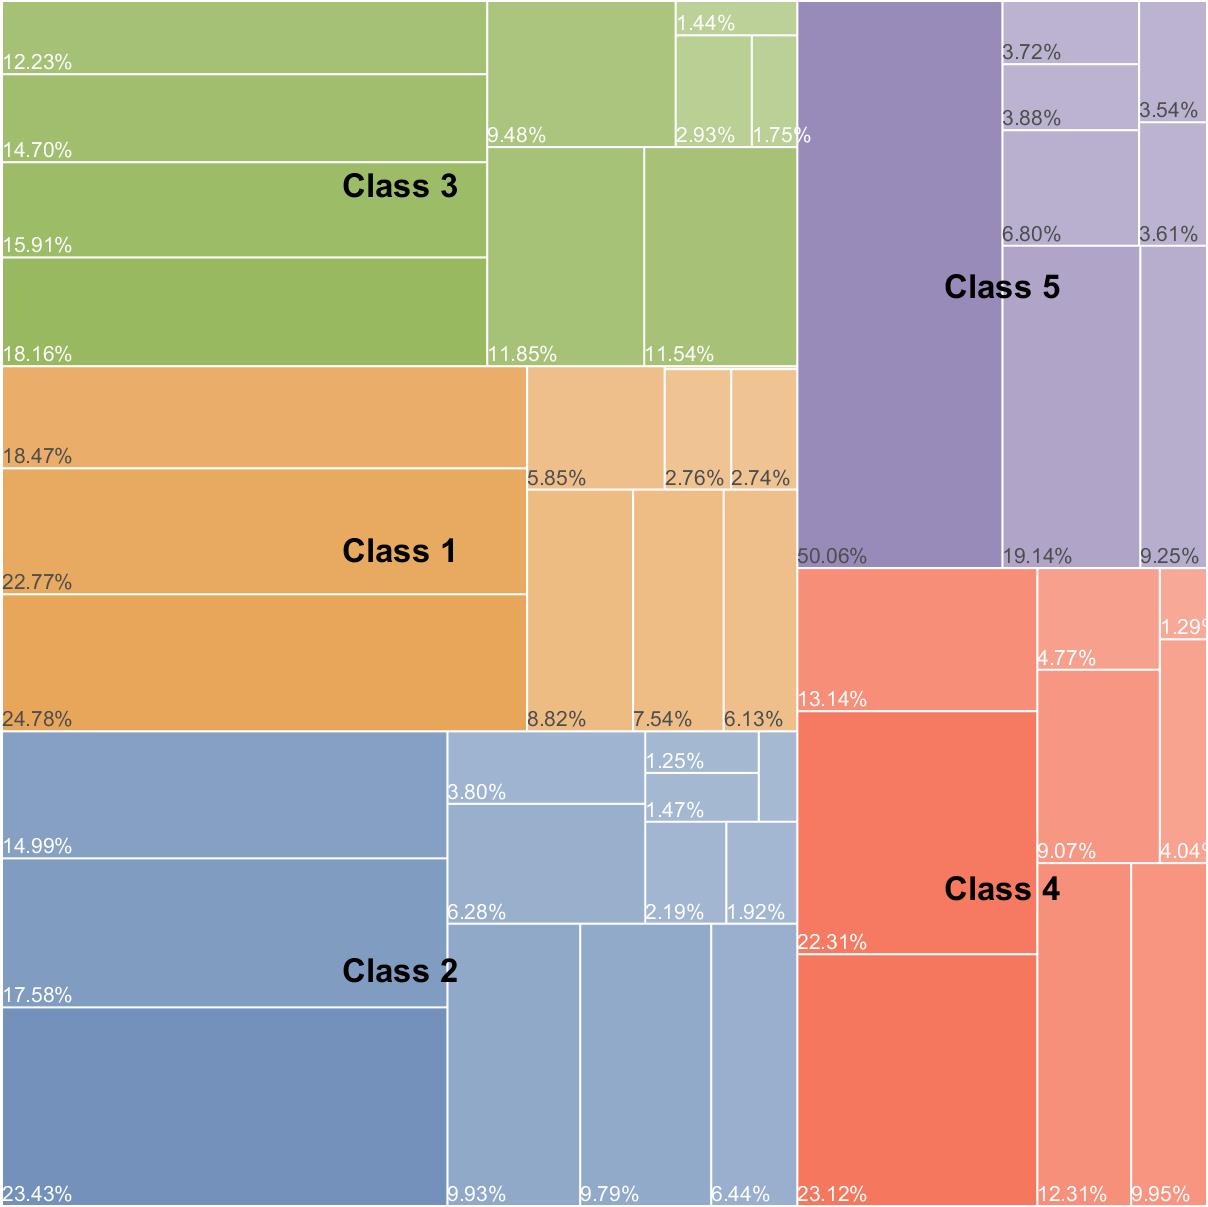
色块其他属性设置
使用setPatch(varargin)设置其他属性,patch对象具有的属性均可被设置(例如把边缘变成白色):
CT.setPatch('EdgeColor',[1,1,1])
字体设置
使用
- setFont(varargin)
- setLabel(varargin)
分别设置元素标签和类标签的字体,举个例子:
CT.setFont('FontName','Cambria','FontSize',16)
CT.setLabel('FontName','Cambria','FontSize',25,'Color',[0,0,.8])
工具函数完整代码
classdef rectTree
% @author : slandarer
% gzh : slandarer随笔
properties
ax,Data,Class,varargin,CS,HS,index,hdlSet
arginList='ColorOrder','Name','ClassName'
classNum=1;
classSet=[];
classRatio=[];
ColorOrder=[80,118,169;226,144,50;127,167,58;242,86,54;126,109,167;
196,98,37;74,148,189;255,182,46;161,86,144;134,138,33;
240,73,53;90,123,207;254,147,44;186,79,115;35,170,102]./255;
Name=[];
ClassName=[];
posSet=zeros(0,4);
end
methods
function obj=rectTree(Data,Class,varargin)
obj.Data=Data(:);
obj.Class=Class(:);
obj.classSet=unique(Class);
obj.classNum=length(obj.classSet);
obj.Namelength(Class)='';
% 计算比例
for i=1:obj.classNum
obj.classRatio(i)=sum(obj.classSet(i)==obj.Class);
end
obj.classRatio=obj.classRatio./sum(obj.classRatio);
% 获取其他数据
for i=1:2:(length(varargin)-1)
tid=ismember(obj.arginList,varargini);
if any(tid)
obj.(obj.arginListtid)=varargini+1;
end
end
[~,tind]=sort(obj.classRatio,'descend');
obj.classRatio=obj.classRatio(tind);
obj.classSet=obj.classSet(tind);
if length(obj.ClassName)<obj.classNum
for i=1:obj.classNum
obj.ClassNamei=['Class ',num2str(i)];
end
end
obj.index=tind;
obj.ClassName=obj.ClassName(tind);
obj.varargin=varargin;
end
function obj=draw(obj)
obj.ax=gca;hold on
obj.ax.XLim=[0,1];
obj.ax.YLim=[0,1];
obj.ax.XTick=[];
obj.ax.YTick=[];
obj.ax.XColor='none';
obj.ax.YColor='none';
obj.ax.PlotBoxAspectRatio=[1,1,1];
% =============================================================
% 计算各类位置(obj.posSet)
tClassRatio=obj.classRatio;
tCumClassRatio=cumsum(tClassRatio);
meanPos=[0,0,1,1];
typeInd=1;
for i=1:obj.classNum
p5Index=find(tCumClassRatio>.5,1);
switch(typeInd)
case 1
tPos=meanPos;
meanPos=tPos;compPos=tPos;
meanPos(3)=tPos(3).*tCumClassRatio(p5Index);
compPos(1)=tPos(1)+tPos(3).*tCumClassRatio(p5Index);
compPos(3)=tPos(3).*(1-tCumClassRatio(p5Index));
case 0
tPos=meanPos;
meanPos=tPos;compPos=tPos;
meanPos(4)=tPos(4).*tCumClassRatio(p5Index);
compPos(2)=tPos(2)+tPos(4).*tCumClassRatio(p5Index);
compPos(4)=tPos(4).*(1-tCumClassRatio(p5Index));
end
tClassPartRatio=tCumClassRatio(1:p5Index);
disp(char([64 97 117 116 104 111 114 32 58 32 115 108 97 110 100 97 114 101 114]))
tClassPartRatio=[0,tClassPartRatio./max(tClassPartRatio)];
for j=1:p5Index
switch(typeInd)
case 1
tPos=meanPos;
obj.posSet=[obj.posSet;tPos(1),tPos(2)+tPos(4)*tClassPartRatio(j),...
tPos(3),tPos(4)*(tClassPartRatio(j+1)-tClassPartRatio(j))];
case 0
tPos=meanPos;
obj.posSet=[obj.posSet;tPos(1)+tPos(3)*tClassPartRatio(j),tPos(2),...
tPos(3)*(tClassPartRatio(j+1)-tClassPartRatio(j)),tPos(4)];
end
end
meanPos=compPos;
typeInd=mod(typeInd+1,2);
tClassRatio(1:p5Index)=[];
if isempty(tClassRatio),break;end
tClassRatio=tClassRatio./sum(tClassRatio);
tCumClassRatio=cumsum(tClassRatio);
end
% =============================================================
% 计算各类矩形树位置
for n=1:obj.classNum
% drawSquare(obj.posSet(n,:),obj.ColorOrder(n,:));
tRatio=obj.Data(obj.classSet(n)==obj.Class);
tRatio=tRatio(:).';
tRatio=tRatio./sum(tRatio);
[~,tind]=sort(tRatio,'descend');
tRatio=tRatio(tind);
obj.CS(n).R=tRatio;
obj.CS(n).P=zeros(0,4);
obj.CS(n).S=obj.Name(obj.classSet(n)==obj.Class);
obj.CS(n).S=obj.CS(n).S(tind);
tCumRatio=cumsum(tRatio);
meanPos=obj.posSet(n,:);
typeInd=1;
% ---------------------------------------------------------
for i=1:length(tRatio)
p5Index=find(tCumRatio>.5,1);
switch(typeInd)
case 1
tPos=meanPos;
meanPos=tPos;compPos=tPos;
meanPos(3)=tPos(3).*tCumRatio(p5Index);
compPos(1)=tPos(1)+tPos(3).*tCumRatio(p5Index);
compPos(3)=tPos(3).*(1-tCumRatio(p5Index));
case 0
tPos=meanPos;
meanPos=tPos;compPos=tPos;
meanPos(4)=tPos(4).*tCumRatio(p5Index);
compPos(2)=tPos(2)+tPos(4).*tCumRatio(p5Index);
compPos(4)=tPos(4).*(1-tCumRatio(p5Index));
end
tPartRatio=tCumRatio(1:p5Index);
tPartRatio=[0,tPartRatio./max(tPartRatio)];
for j=1:p5Index
switch(typeInd)
case 1
tPos=meanPos;
obj.CS(n).P=[obj.CS(n).P;tPos(1),tPos(2)+tPos(4)*tPartRatio(j),...
tPos(3),tPos(4)*(tPartRatio(j+1)-tPartRatio(j))];
case 0
tPos=meanPos;
obj.CS(n).P=[obj