matplotlib 笔记:add_axes
Posted UQI-LIUWJ
tags:
篇首语:本文由小常识网(cha138.com)小编为大家整理,主要介绍了matplotlib 笔记:add_axes相关的知识,希望对你有一定的参考价值。
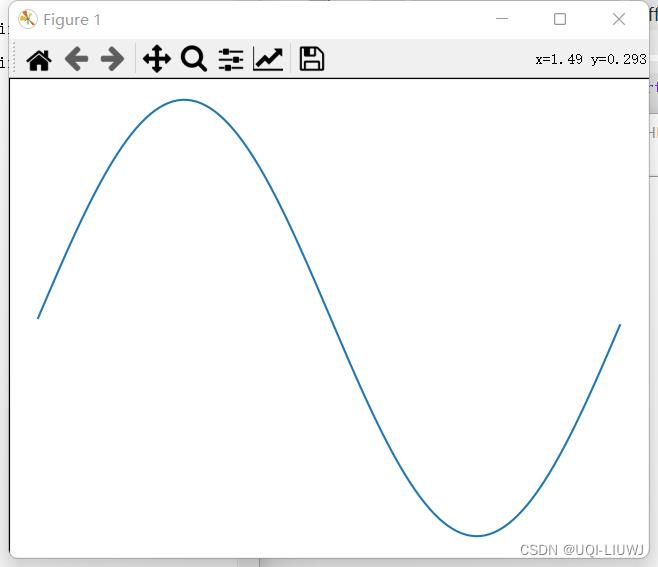
为画布添加轴,add_axes方法需要一个由4个元素组成的list对象,分别对应图形的左、底、宽、高。每个数字必须在0和1之间。
from matplotlib import pyplot as plt
import numpy as np
import math
x = np.arange(0, math.pi*2, 0.05)
y = np.sin(x)
fig = plt.figure()
ax = fig.add_axes([0,0,1,1])
ax.plot(x,y)
plt.show()
| 默认 | ax = fig.add_axes([0,0,1,1])
|
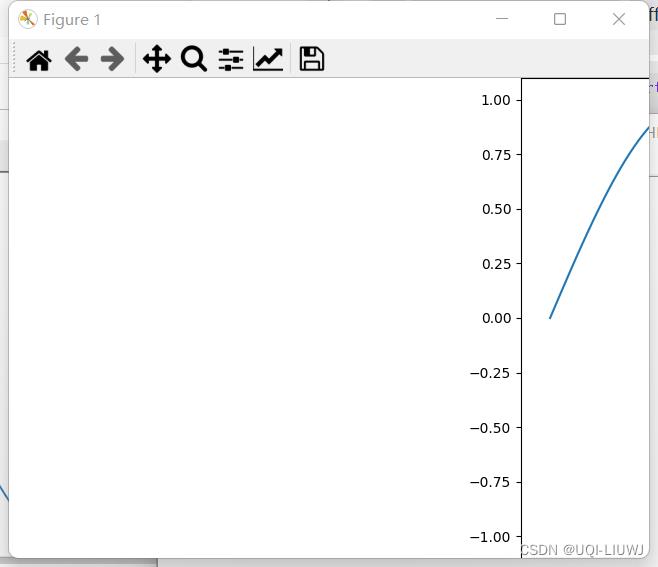
| 左 | ax = fig.add_axes([0.8,0,1,1])
|
| 底 |  |
| 宽 | ax = fig.add_axes([0,0,0.2,1])
|
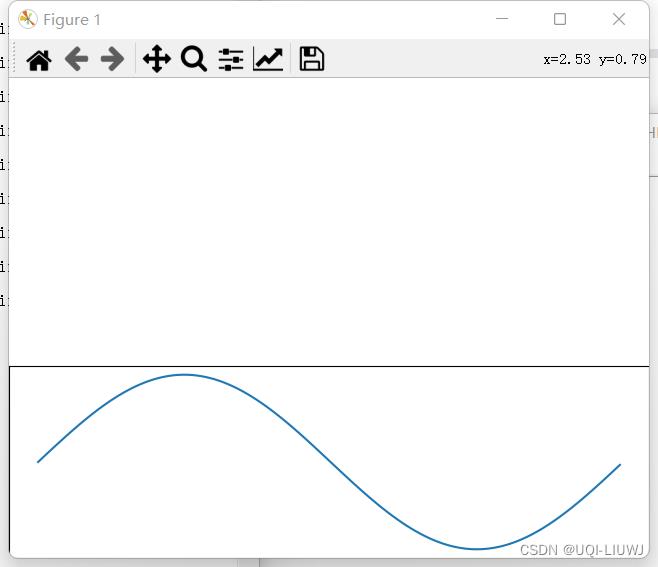
| 高 | ax = fig.add_axes([0,0,1,0.4])
|

以上是关于matplotlib 笔记:add_axes的主要内容,如果未能解决你的问题,请参考以下文章