前端使用Apache ECharts时,常用的配置项介绍
Posted 水香木鱼
tags:
篇首语:本文由小常识网(cha138.com)小编为大家整理,主要介绍了前端使用Apache ECharts时,常用的配置项介绍相关的知识,希望对你有一定的参考价值。
一、博主介绍
💒首页:水香木鱼
🛫专栏:ECharts
✍简介: 博主:花名 “水香木鱼”,星座"水瓶座一枚"
🔰 格言: 生活是一面镜子。 你对它笑, 它就对你笑; 你对它哭, 它也对你哭。
🔋 充电:相信付出终将会得到回报!
二、笔芯文章
本期为伙伴们带来的是echarts 图表的配置项与我们常用的小功能
以下为木鱼在开发中使用的图表代码模板:
注意:这是一套通用的写法与图表适配,在开发中,使用代码模板,只需在option 属性中添加对应的图表即可。
  mounted()
    this.myEcharts();
  ,
  methods:
    myEcharts()
      var accessToElements = document.getElementById("fourConter"); //绑定元素
      var themeStyle = echarts.init(accessToElements, "test-chart-theme"); //定制主题
      //图表自适应配置
      const chartNode = new ResizeObserver(() =>
        themeStyle.resize();
      );
      chartNode.observe(accessToElements);
      // 绘制图表
      var option =

      //...图表的内容部分

	;
      option && themeStyle.setOption(option);
    ,
下面我们进入正文 👇
1.全局引用【适用于小型项目或者demo】
//main.js

//引入echarts
import * as echarts from 'echarts'
//挂载到vue原型上
Vue.prototype.$echarts=echarts
2.按需引用echarts的 正确写法:【大型项目适用】
//main.js文件

//引入vue实例
import Vue from 'vue'
// 引入基本模板
let echarts = require('echarts/lib/echarts')

// 引入柱状图组件,看需求引不同的组件
require('echarts/lib/chart/bar')

// 引入提示框和title组件
require('echarts/lib/component/tooltip')
require('echarts/lib/component/title')

//挂载到vue原型对象上
Vue.prototype.$echarts = echarts
一、配置项描述
title://标题组件tooltip:,//提示框组件yAxis:[],//y轴xAxis:[],//x轴legend:,//图例组件grid:,//内绘网格toolbox:,//工具series:[],//数据有关calculable:true//可计算特性
二、常用配置
(1)、x轴文字超出溢出隐藏

在
axisLabel属性中添加formatter
限制params 文字的字数为6位【可根据需求自行调整字数】
formatter: function (params)
	var val = "";
	if (params.length > 6)
		val = params.substr(0, 6) + "...";
			return val;
		 else
		return params;

,
(2)、x轴文字倾斜
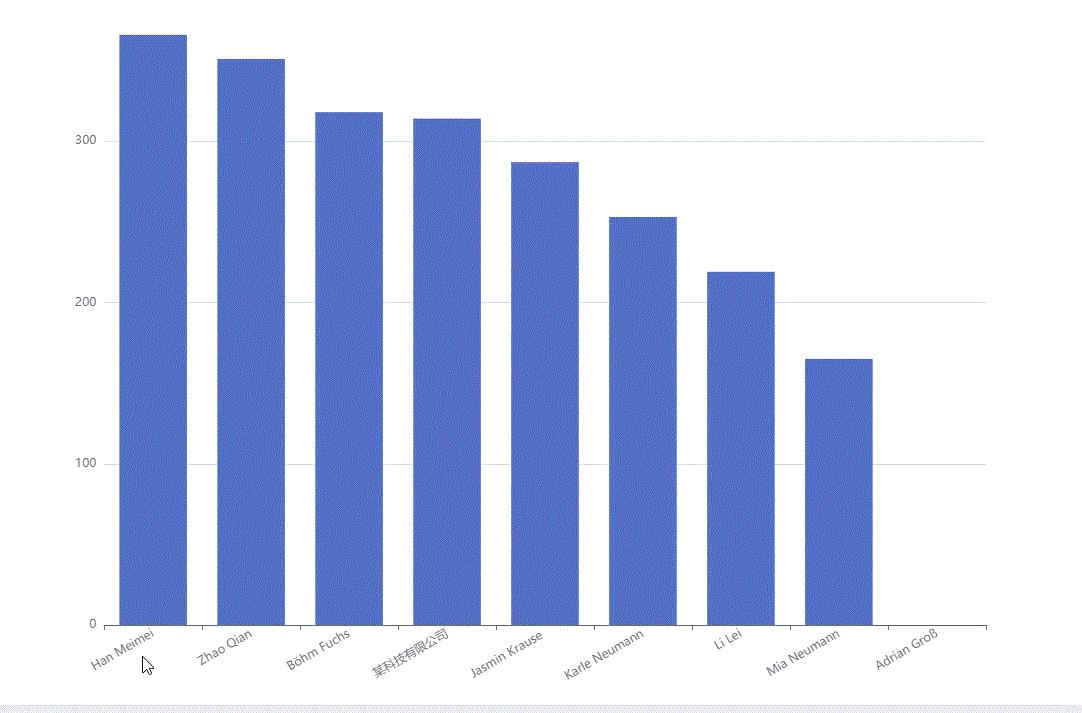
在
xAxis属性中,添加axisLabel属性
intervalrotate
xAxis:
	type: 'category',
	axisLabel:  interval: 0, rotate: 30
,
(3)、设置图表标题
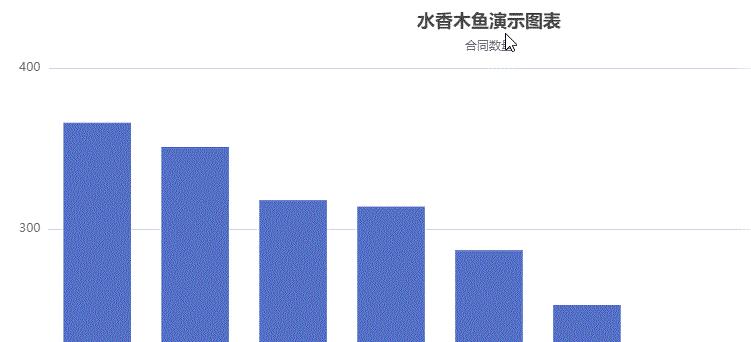
在
option属性中添加title
title属性内设置text,为图表一级标题left为标题的位置subtext为图表二级标题
title:
	text: "水香木鱼演示图表",
	subtext: "合同数量",
	left: "center",
,
(4)、饼图放大、缩小
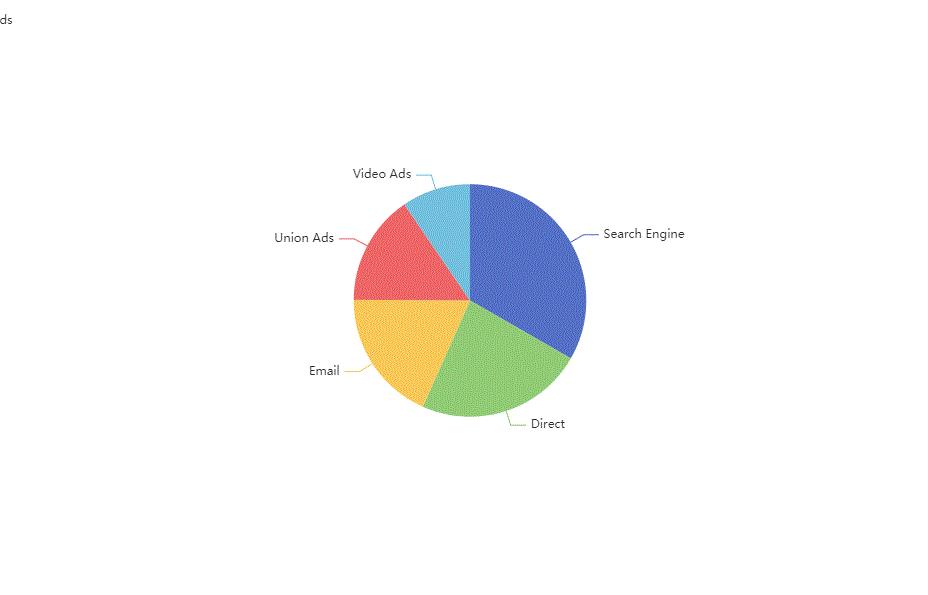
在
series属性中,添加/调整radius属性 [0%~100%]
series:[

		type: 'pie',
		radius: '60%',

]
(5)、调整柱状图的间距
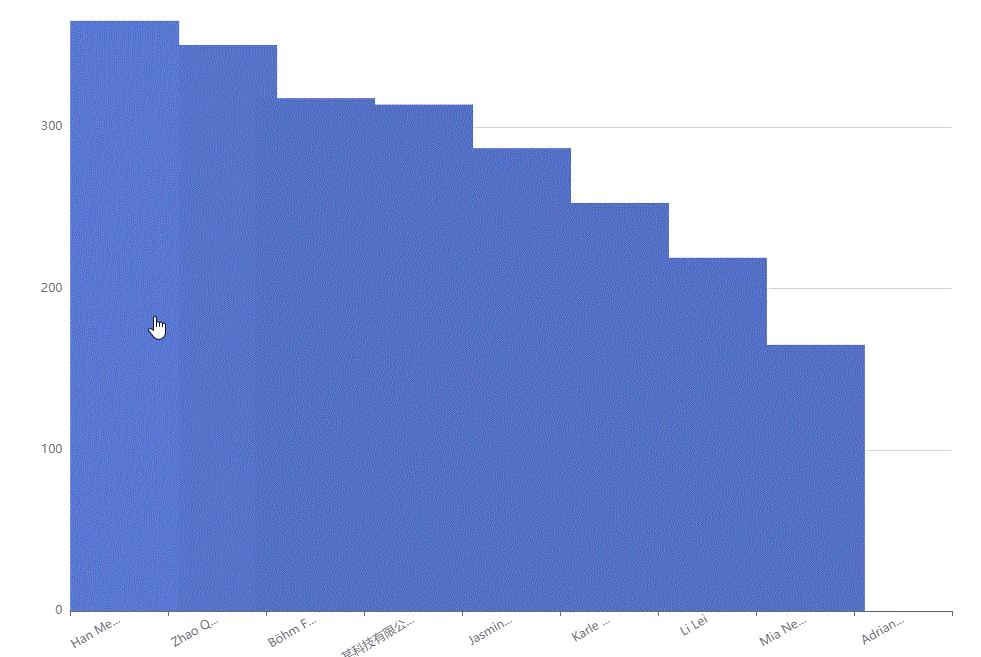
在
series属性中,添加barWidth、barGap
series: [

		type: "bar",
		barWidth: 20, // 表示柱图宽度
		barGap: 36, // 表示柱图之间的间距
	,
],
(6)、调整图例切换的位置

在
option属性中,添加legend属性
left值为rightbottom值为bottom
  legend:
    orient: 'vertical',
    bottom: 'bottom'
  ,
(7)、调整图例的icon与宽度、位置
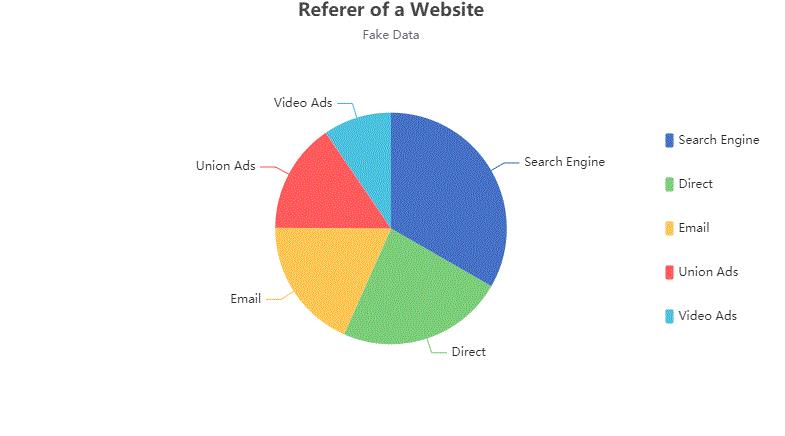
在
option属性中添加legend
legend:
	icon: 'circle',//圆形
	itemWidth: 8,//图标的宽度
	top: 'center',
    left: '85%',
    itemGap: 30,//为上下间距
,
(8)、饼图中间显示文字【调整字体大小】
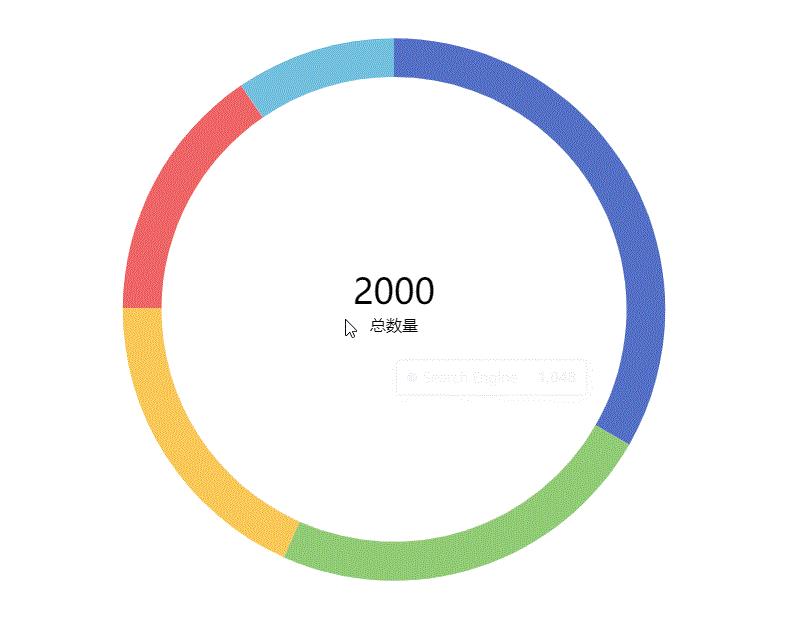
在
series属性中,添加label
radiuscenterlabel【normal】关键代码
series:[

		type: 'pie',
		radius: ['60%', '70%'],
		center: ['50%', '50%'],
		//关键代码
		label:
			normal:
				show: true,
				position: 'center',//将文字定位到饼图中心
				formatter: 'total|2000\\nactive|总数量', //中心文字显示
				    //自定义的字体样式
					rich:
						total:
							fontSize: 35,
						,
						active:
							fontSize: 16,
							lineHeight:30,
						,

			,
		,

]
三、博主致谢
感谢小伙伴们,耐心的阅读完本篇文章,关注👉 水香木鱼🔔 获取更多精彩文章!
⭐⭐⭐ 别忘记一键三连呦!
以上是关于前端使用Apache ECharts时,常用的配置项介绍的主要内容,如果未能解决你的问题,请参考以下文章