4Go语言单元测试性能测试与监控
Posted 行走的皮卡丘
tags:
篇首语:本文由小常识网(cha138.com)小编为大家整理,主要介绍了4Go语言单元测试性能测试与监控相关的知识,希望对你有一定的参考价值。

4、Go语言单元测试、性能测试与监控
1、单元测试
1.1 单元测试简介
单元测试用来检测某个模块、某个函数的执行结果是否正确,也因此能够实现监控代码质量。 Go语言中自带有一个轻量级的测试框架 testing,同时也自带了
go test命令,可以通过这些工具来实现单元测试和性能测试。
1.2 testing的使用
go自带的testing单元测试框架使用要求:
- 测试代码必须放在以
_test.go结尾的文件中 - 测试函数以
Test为名称前缀 - 命令
go test会忽略以_或.开头的测试文件 - 命令
go build/install等正常编译操作会忽略测试文件
1.3 案例
文件目录:
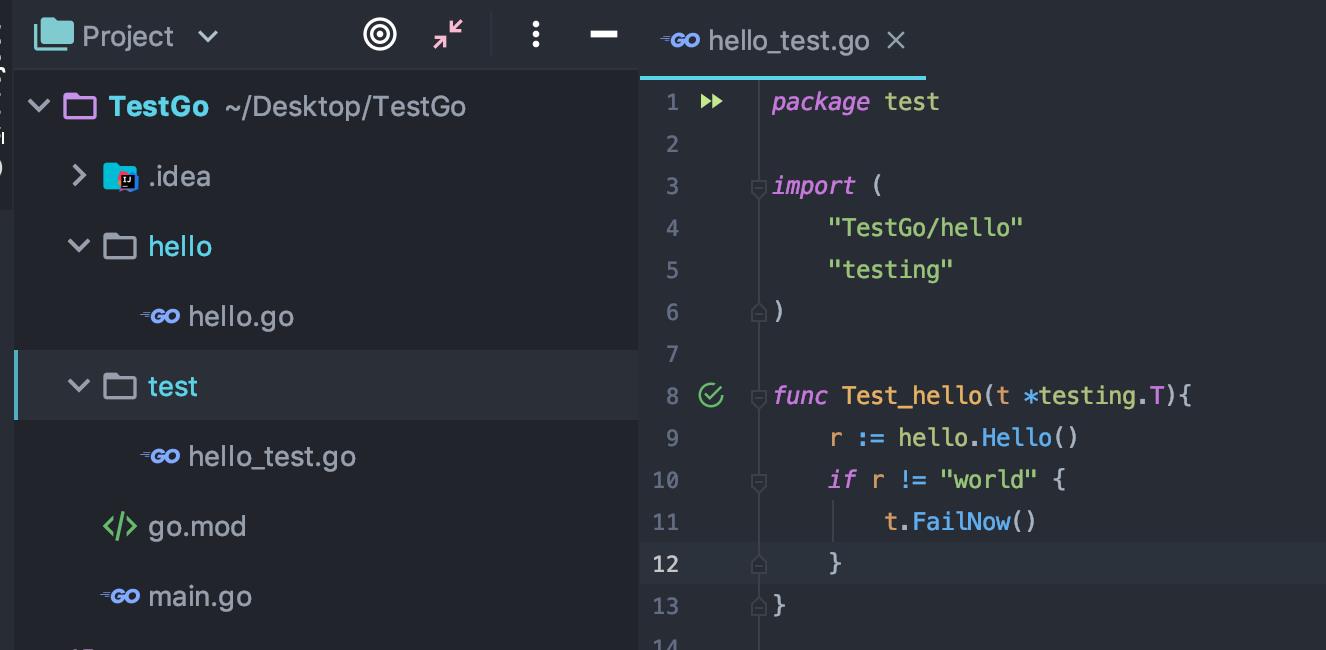
源码文件:/hello/hello.go
package hello

import "fmt"

func Hello() string
	return "world"
单元测试文件:/test/hello_test.go
package test

import (
	"TestGo/hello"
	"testing"
)

func Test_hello(t *testing.T)
	r := hello.Hello()
	if r != "world"
		t.FailNow()
运行测试文件:没有main方法也可以执行
# -v用于显示详细测试流程
go test -v test/hello_test.go

# 只执行Test_hello
go test -v -run Test_hello test/hello_test.go
1.4 测试中一些函数的区别
Fail,Error:若测试失败,则测试会继续执行FailNow,Fatal:若测试失败,则测试会终止
2、代码覆盖率
代码覆盖率命令:
go test -v -cover
3、断言库
使用一些第三方的断言库也可以达到原生的单元测试效果:
import "github.com/stretchr/testify/assert"
func Test_hello(t *testing.T)
	r := hello.Hello()
	assert.Equal("world")
4、BDD测试框架
常用的BDD测试框架:https://github.com/smartystreets/goconvey
5、基准测试
5.1 基准测试简介
基准测试可以测试一段程序的运行性能及耗费CPU的程度。 性能测试函数以Benchmark为名称前缀,同样保存在
*_test.go文件里。
5.2 基准测试案例
需要被基准测试的方法写为:
func Benchmark_Hello(b *testing.B)

	// 开始测试性能相关代码
	b.ResetTimer()
	for i := 0; i < b.N; i++
		//  测试代码


	// 结束性能测试
	b.StopTimer()
测试:
# win下命令为 -bench="-"  -bench=.表示运行后面文件里的所有基准测试。
go test -v -bench=.  		# 添加参数
常用参数:
-benchmem 			# 显示性能具体的开销情况
-benchtime=5s		# 自定义测试时间为5秒
-bench=Alloc		# 显示内存分配
6、性能监控
利用go的 runtime/pprof 包可以生成prof文件,用来查看go代码的运行情况,示例代码:
package main

import (
	"fmt"
	"os"
	"runtime/pprof"
)

func slowFunc()

	str := "hello world "
	for i := 0; i < 5; i++
		str += str


func main()

	// 创建输出文件
	f, err := os.Create("cpu.prof")
	if err != nil
		fmt.Println("create cpu.prof err :", err)
		return

	// 获取系统信息
	if err := pprof.StartCPUProfile(f); err != nil
		fmt.Println("start cpu.prof err :", err)
		return

	defer pprof.StopCPUProfile()

	// 业务代码
	slowFunc()

	// 获取内存相关信息
	f1, err := os.Create("mem.prof")
	defer f1.Close()
	if err != nil
		fmt.Println("create mem.prof err :", err)
		return

	// runtime.GC()			// 是否获取最新的数据信息
	if err := pprof.WriteHeapProfile(f1); err != nil
		fmt.Println("write cpu.prof err :", err)
		return


	// 获取协程相关信息
	f2, err := os.Create("goroutine.prof")
	defer f2.Close()
	if err != nil
		fmt.Println("create goroutine.prof err :", err)
		return

	if gProf := pprof.Lookup("goroutine"); gProf != nil
		fmt.Println("write goroutine.prof err :", err)
		return
	 else
		gProf.WriteTo(f2, 0)


	return
生成prof文件:
# 生成程序的二进制文件
go build -o program main.go		// 此时会按照代码中的要求生成多份prof文件

# 查看prof文件
go tool pprof program cpu.prof
贴士:
- 导入
"_ "net/http/pprof"包还可以实现以网页形式展示prof文件内容! - 程序执行前加上环境变量可以查看GC日志,如:
GODEBUG=gctrace=1 go run main.go
7、常见的调优参数
常见调优参数:
Wall Time:程序运行的绝对时间、函数运行的绝对时间被阻塞的影响CPU消耗时间内存分配GC次数、GC耗时

以上是关于4Go语言单元测试性能测试与监控的主要内容,如果未能解决你的问题,请参考以下文章