CIFAR10数据可视化
Posted smbx-ztbz
tags:
篇首语:本文由小常识网(cha138.com)小编为大家整理,主要介绍了CIFAR10数据可视化相关的知识,希望对你有一定的参考价值。
一、数据准备
下载cifar-10-binary.tar.gz并解压,其中有多个bin文件,现对data_batch_1.bin进行可视化。
二、数据说明
该二进制文件存储的有10000张32X32的三通道图片以及对应的label。
具体存放方式为第一个字节先存该张图的label,即该张图属于哪一类,数值从0~9,接着3072(32X32X3)个字节存放对应的图片,图片降维成一维,按rgb的顺序进行存放。
三、matlab2016代码
在数据同目录下新建show_cifar10_data.m
clear;
clc;
close all;
strings={
    ‘airplane‘
    ‘automobile‘
    ‘bird‘
    ‘cat‘
    ‘deer‘
    ‘dog‘
    ‘frog‘
    ‘horse‘
    ‘ship‘
    ‘truck‘
    };
image_file_name=‘data_batch_1.bin‘;
fid1=fopen(image_file_name,‘rb‘);
images_data=fread(fid1,‘uint8‘);
fclose(fid1);

images_data=reshape(images_data,3073,[])‘;%读取进来的数据按列进行存放,为了之后按行正确读取,要对reshape后的数据进行转置,size为10000x3073
image_idx=images_data(:,1);%10000x1,第一列为图片点的label

for k=1:100:size(images_data,1)
    figure(100);
    for t=1:100
        image_r=reshape(images_data(k+t-1,2:1025),32,[])‘;%reshape且转置
        image_g=reshape(images_data(k+t-1,1026:2049),32,[])‘;
        image_b=reshape(images_data(k+t-1,2050:3073),32,[])‘;
        image_buffer=cat(3,image_r,image_g,image_b);
        subplot(10,10,t);
        imshow(uint8(image_buffer));
        title(strings{image_idx(k+t-1)+1});%label对应的string
    end
    input(‘press enter to next picture:‘);
    pause;
end
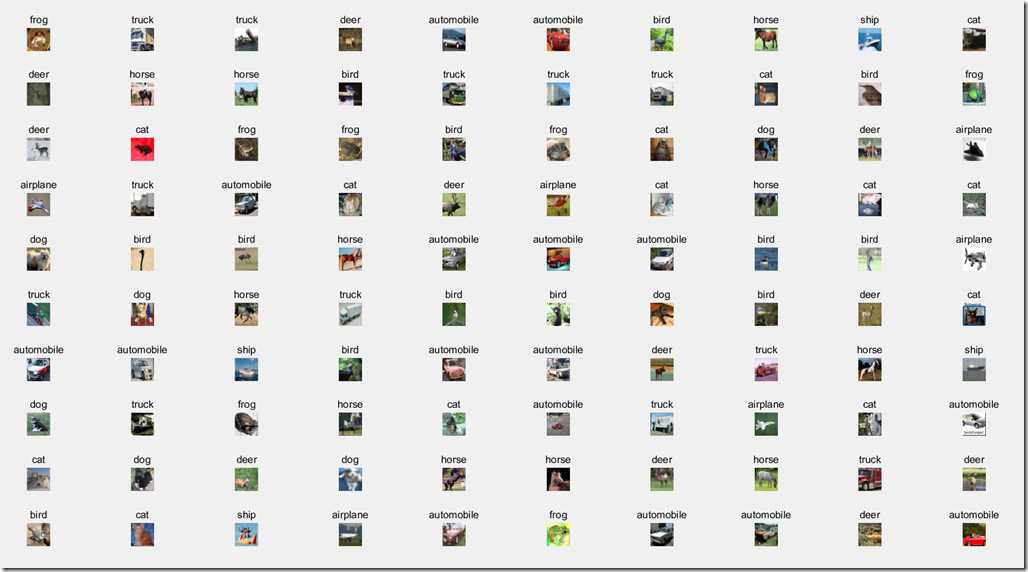
效果:
以上是关于CIFAR10数据可视化的主要内容,如果未能解决你的问题,请参考以下文章
