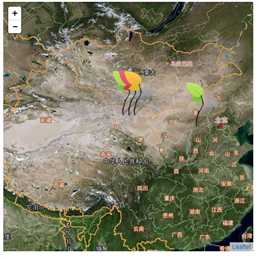
004 Leaflet 第四个demo 使用自己的图标替换marker图标
Posted
tags:
篇首语:本文由小常识网(cha138.com)小编为大家整理,主要介绍了004 Leaflet 第四个demo 使用自己的图标替换marker图标相关的知识,希望对你有一定的参考价值。
一、使用到的文件
leaflet.css
jquery-1.11.1.min.js
leaflet.js
leaf-green.png
leaf-orange.png
leaf-red.png
leaf-shadow.png
这个列子挺简单的,用的官网给的出的列子,图片也可以从官网找到。
二、源码
<!DOCTYPE html>
<html>
<head>
    <title>使用自己的图标替换marker图标</title>
    <link rel="stylesheet" href="https://unpkg.com/[email protected]/dist/leaflet.css" />
    <script src="http://code.jquery.com/jquery-1.11.1.min.js"></script>
    <script src="https://unpkg.com/[email protected]/dist/leaflet.js"></script>
</head>

<body>
    <div id="map" style="width:500px;height:500px;"></div>
     <script type="text/javascript">
     $(function(){
        var map = L.map(‘map‘, {
            center: [40, 100],
            zoom: 4
        });
        // 影像
        L.tileLayer("http://t{s}.tianditu.cn/img_w/wmts?service=wmts&request=GetTile&version=1.0.0&LAYER=img&tileMatrixSet=w&TileMatrix={z}&TileRow={y}&TileCol={x}&style=default&format=tiles", {
            subdomains: ["0", "1", "2", "3", "4", "5", "6", "7"]
        }).addTo(map);
        // 地名标注
        L.tileLayer("http://t{s}.tianditu.cn/cia_w/wmts?service=wmts&request=GetTile&version=1.0.0&LAYER=cia&tileMatrixSet=w&TileMatrix={z}&TileRow={y}&TileCol={x}&style=default&format=tiles", {
            subdomains: ["0", "1", "2", "3", "4", "5", "6", "7"]
        }).addTo(map);
        // 边界
        L.tileLayer("http://t{s}.tianditu.cn/ibo_w/wmts?service=wmts&request=GetTile&version=1.0.0&LAYER=ibo&tileMatrixSet=w&TileMatrix={z}&TileRow={y}&TileCol={x}&style=default&format=tiles", {
            subdomains: ["0", "1", "2", "3", "4", "5", "6", "7"]
        }).addTo(map);
        // 使用用户自己的图标
        var greenIcon = L.icon({
            iconUrl: ‘leaf-green.png‘,
            shadowUrl: ‘leaf-shadow.png‘,

            iconSize:     [38, 95], // size of the icon
            shadowSize:   [50, 64], // size of the shadow
            iconAnchor:   [22, 94], // point of the icon which will correspond to marker‘s location
            shadowAnchor: [4, 62],  // the same for the shadow
            popupAnchor:  [-3, -76] // point from which the popup should open relative to the iconAnchor
        });
        L.marker([40, 112], {icon: greenIcon}).addTo(map);

        var LeafIcon = L.Icon.extend({
        options: {
            shadowUrl: ‘leaf-shadow.png‘,
            iconSize:     [38, 95],
            shadowSize:   [50, 64],
            iconAnchor:   [22, 94],
            shadowAnchor: [4, 62],
            popupAnchor:  [-3, -76]
        }
        });
        var greenIcon = new LeafIcon({iconUrl: ‘leaf-green.png‘}),
        redIcon = new LeafIcon({iconUrl: ‘leaf-red.png‘}),
        orangeIcon = new LeafIcon({iconUrl: ‘leaf-orange.png‘});

        L.icon = function (options) {
        return new L.Icon(options);
        };

        L.marker([41.5, 99.09], {icon: greenIcon}).addTo(map).bindPopup("I am a green leaf.");
        L.marker([41.495, 100.083], {icon: redIcon}).addTo(map).bindPopup("I am a red leaf.");
        L.marker([41.49, 101.1], {icon: orangeIcon}).addTo(map).bindPopup("I am an orange leaf.");

    });
</script>
</body>
</html>
三、效果图

以上是关于004 Leaflet 第四个demo 使用自己的图标替换marker图标的主要内容,如果未能解决你的问题,请参考以下文章