图像边缘提取
Posted wangtianning1223
tags:
篇首语:本文由小常识网(cha138.com)小编为大家整理,主要介绍了图像边缘提取相关的知识,希望对你有一定的参考价值。
图像的边界信息一般通过灰度值突变来体现,所以图像边缘提取一般通过捕捉灰度突变的方法来实现,捕捉灰度突变可以通过求微分来实现
导数越大说明变化越大,边缘信号越强
1.Sobel算子
也叫离散微分算子,一阶微分算子,求导算子,先做高斯平滑在做微分求导
可以在各个方向上求图像的梯度
如水平方向 Gx=[-1,0,1,-2,0,2,-1,0,1],垂直方向Gy=[-1,-2,-1,0,0,0,1,2,1]
最终G=sqrt(Gx^2+Gy^2),或者G=|Gx|+|Gy|
第二种的运算速度要快于第一种,所以一般采用第二种方法
Sobel算子的改进版叫Scharr算子[-3,0,3,-10,0,10,-3,0,3]
#include<iostream>
#include<opencv2/opencv.hpp>

using namespace std;
using namespace cv;

int main(int argc, char **argv)
{
    Mat src, dst;
    src = imread("b.png");
    if (src.empty())
    {
        cout << "load img failed" << endl;
        return -1;
    }
    imshow("input img", src);

    Mat gaussian,gray_src;
    GaussianBlur(src, gaussian, Size(3, 3), 0, 0);
    cvtColor(gaussian, gray_src, CV_BGR2GRAY);
    imshow("blur gray", gray_src);

    Mat xgrad, ygrad;
    Sobel(gray_src, xgrad, CV_16S, 1, 0, 3);
    Sobel(gray_src, ygrad, CV_16S, 0, 1, 3);
    convertScaleAbs(xgrad, xgrad);
    convertScaleAbs(ygrad, ygrad);
    imshow("x grade", xgrad);
    imshow("y grade", ygrad);

    addWeighted(xgrad, 0.5, ygrad, 0.5, 0, dst);
    imshow("output img", dst);
    /*
    dst = Mat(xgrad.size(), xgrad.type());
    int width = dst.cols;
    int height = dst.rows;
    for(int i=0;i<height;++i)
        for (int j = 0; j < width; ++j)
        {
            int xg = xgrad.at<char>(i, j);
            int yg = ygrad.at<char>(i, j);
            int xy = xg + yg;
            dst.at<char>(i, j) = saturate_cast<uchar>(xy);
        }
    imshow("output img", dst);*/
    waitKey(0);
    return 0;
}
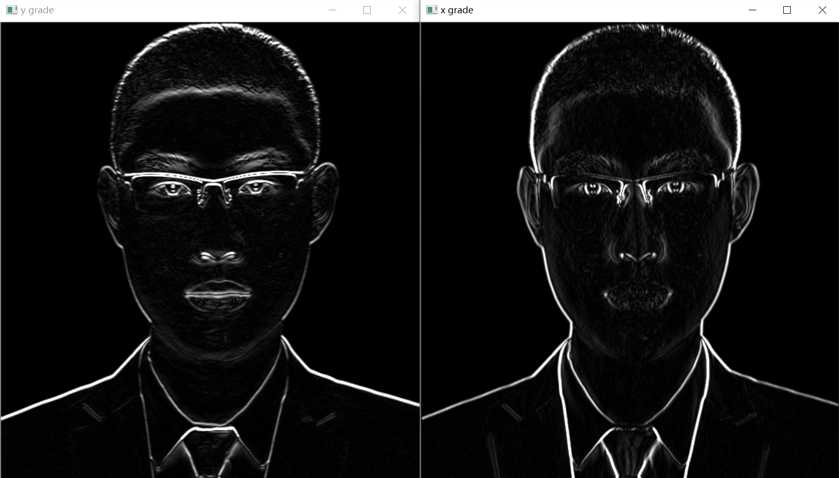
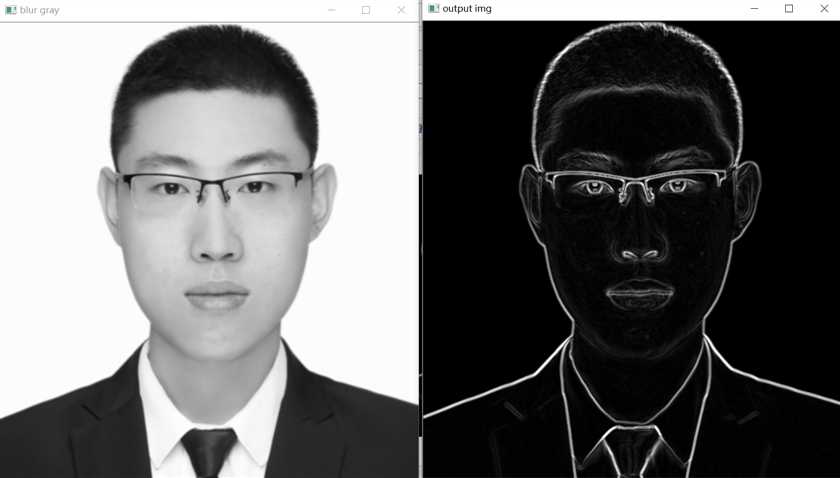
2.Laplance算子
求二阶导数,在二阶导数的时候,最大变化处的值为0,即边缘的二阶导数是0
流程:
高斯模糊去噪GaussianBlur()
转为灰度值cvtColor()
Laplance二阶导数计算Laplancian()
取绝对值convertScaleAbs()
显示结果
#include<iostream>
#include<opencv2/opencv.hpp>

using namespace std;
using namespace cv;

int main(int argc, char **argv)
{
    Mat src, dst;
    src = imread("b.png");
    if (src.empty())
    {
        cout << "load img failed" << endl;
        return -1;
    }
    imshow("input img", src);

    Mat gaussian,gray_src;
    GaussianBlur(src, gaussian, Size(3, 3), 0, 0);
    cvtColor(gaussian, gray_src, CV_BGR2GRAY);
    imshow("blur gray", gray_src);

    Laplacian(gray_src, dst, CV_16S,3);
    convertScaleAbs(dst, dst);
    imshow("Laplacian", dst);
    threshold(dst, dst, 0, 255, THRESH_OTSU | THRESH_BINARY);
    imshow("output img", dst);
    /*
    dst = Mat(xgrad.size(), xgrad.type());
    int width = dst.cols;
    int height = dst.rows;
    for(int i=0;i<height;++i)
        for (int j = 0; j < width; ++j)
        {
            int xg = xgrad.at<char>(i, j);
            int yg = ygrad.at<char>(i, j);
            int xy = xg + yg;
            dst.at<char>(i, j) = saturate_cast<uchar>(xy);
        }
    imshow("output img", dst);*/
    waitKey(0);
    return 0;
}
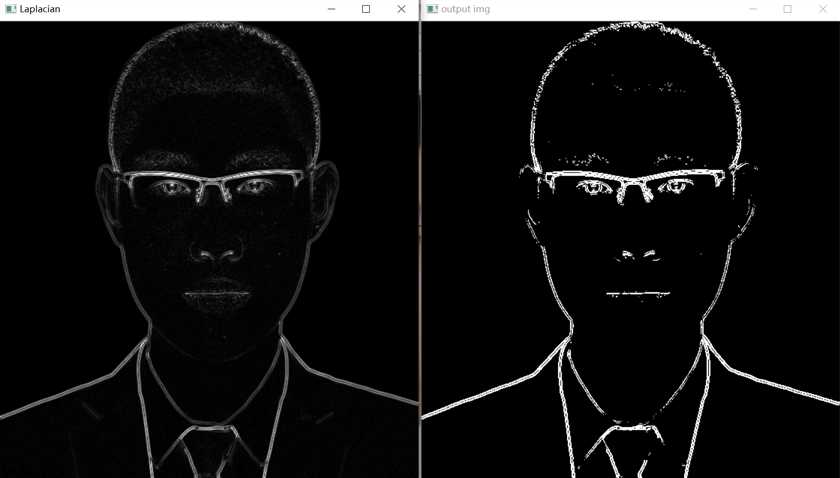
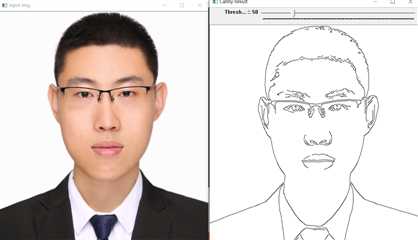
3.Canny边缘检测
步骤:
高斯模糊 GaussianBlur
灰度转换cvtColor
计算梯度Sobel/Scharr
非最大信号抑制
高低阈值输出二值图像
非最大信号抑制需要计算梯度方向
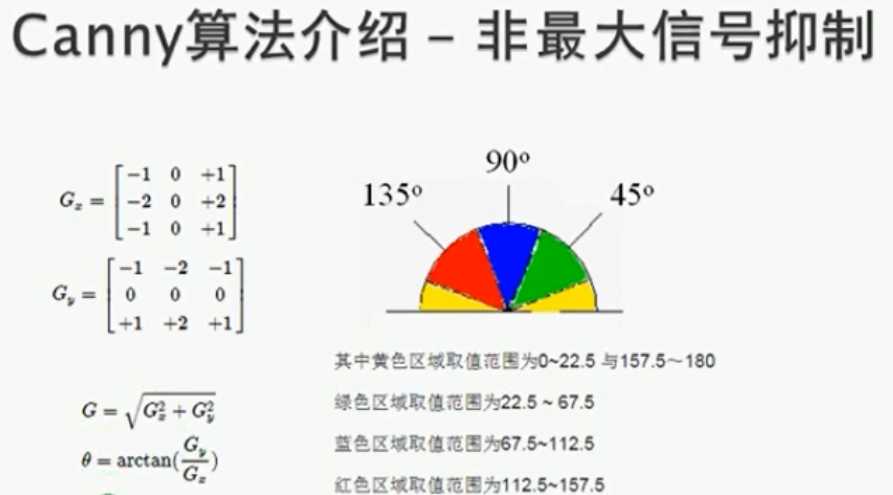
T1为低阈值,T2为高阈值,凡是高于T2的都保留,凡是低于T1的都丢弃,从高于T2的像素出发,凡是大于T1且相互连接的都保留,最终得到一个输出二值图像
推荐的高低阈值比为3:1或2:1
Canny(src,dst,threshold_low,threshold_high,Sobel_size,Lwgradient)
最后一个如果是true就用L2归一化(开根),如果不是就L1归一化(绝对值),一般用L1
#include<iostream>
#include<opencv2/opencv.hpp>

using namespace std;
using namespace cv;

Mat src, dst, gray_src, gaussian;
int t1_value = 50;
int max_value = 255;
const char* OUTPUT_TITLE = "Canny Result";
void Canny_Demo(int,void*);

int main(int argc, char **argv)
{
    //Mat src, dst;
    src = imread("b.png");
    if (src.empty())
    {
        cout << "load img failed" << endl;
        return -1;
    }
    imshow("input img", src);

    //Mat gaussian,gray_src;
    //GaussianBlur(src, gaussian, Size(3, 3), 0, 0);
    namedWindow(OUTPUT_TITLE, CV_WINDOW_AUTOSIZE);
    cvtColor(src, gray_src, CV_BGR2GRAY);
    createTrackbar("Threshold Value :", OUTPUT_TITLE, &t1_value, max_value, Canny_Demo);
    Canny_Demo(0, 0);
    waitKey(0);
    return 0;
}

void Canny_Demo(int, void*)
{
    Mat edge_output;
    blur(gray_src, gray_src, Size(3, 3), Point(-1, -1), BORDER_DEFAULT);
    Canny(gray_src, edge_output, t1_value, t1_value * 2, 3, false);

    //dst.create(src.size(), src.type());
    //src.copyTo(dst, edge_output);
    imshow(OUTPUT_TITLE, ~edge_output);
}
去掉注释会变成彩色图,注意修改imshow中的输出变量
以上是关于图像边缘提取的主要内容,如果未能解决你的问题,请参考以下文章