按数值显示不同渐变颜色柱状图

Posted hzhjxx

tags:

篇首语:本文由小常识网(cha138.com)小编为大家整理,主要介绍了按数值显示不同渐变颜色柱状图相关的知识,希望对你有一定的参考价值。

技术图片 

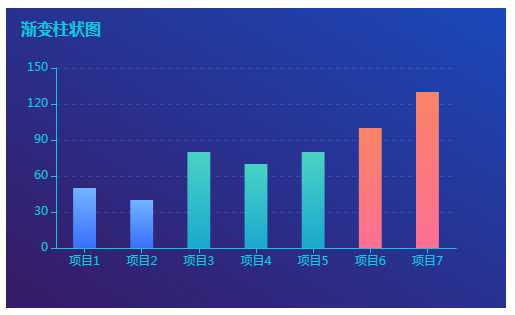
<!DOCTYPE html>
<html>
    <head>
        <meta charset="utf-8">
        <title>按数值显示不同渐变颜色柱状图</title>
        <style>
            .chart-box {
                width: 500px;
                height: 300px;
                background: linear-gradient(to top right, #371a64, #1a48ba);
            }
        </style>
    </head>
    <body>
        <div class="chart-box" id="chart_box"></div>
    </body>    
    <script src="js/echarts.min.js"></script>
    <script>
        f_chart();

        function f_chart() {
            var dom = document.getElementById("chart_box");
            var myChart = echarts.init(dom);
            var app = {};
            var option = null;
            app.title = 柱状图分数划分;
            var namedate = [项目1, 项目2, 项目3, 项目4, 项目5, 项目6, 项目7];
            var numdate = [50, 40, 80, 70, 80, 100, 130];
            var colorlist = [];
            numdate.forEach(element => {
                if (element <= 50) {
                    colorlist.push(["#386ffd", "#74b3ff"])
                } else if (element > 50 && element < 100) {
                    colorlist.push(["#1aa8ce", "#49d3c6"])
                } else {
                    colorlist.push(["#fc7095", "#fa8466"])
                }
            });
            option = {
                title: {
                    text: 渐变柱状图,
                    textStyle: {
                        color: #0bccde,
                        fontSize: 16
                    },
                    top: 10px,
                    left: 10px
                },
                tooltip: {
                    trigger: item
                },
                xAxis: [{
                    type: category,
                    data: namedate,
                    axisTick: {
                        alignWithLabel: true
                    },
                    axisLine: {
                        lineStyle: {
                            color: "#0bccde",
                            width: 1
                        }
                    },
                    axisLabel: {
                        show: true,
                        textStyle: {
                            color: #0bccde
                        }
                    }
                }],
                yAxis: [{
                    type: value,
                    axisLabel: {
                        formatter: {value},
                        show: true,
                        textStyle: {
                            color: #0bccde
                        }
                    },
                    axisLine: {
                        lineStyle: {
                            color: "#0bccde",
                            width: 1
                        }
                    },
                    splitLine: {
                        show: true,
                        lineStyle: {
                            type: dashed,
                            color: rgba(255,255,255,0.1)
                        }
                    }
                }],
                series: [{
                    name: 数据,
                    type: bar,
                    barWidth: 40%,
                    data: numdate,
                    itemStyle: {
                        normal: {                            
                            color: function(params) {
                                var colorList = colorlist
                                var index = params.dataIndex;
                                return new echarts.graphic.LinearGradient(0, 0, 0, 1,
                                    [{
                                            offset: 1,
                                            color: colorList[index][0]
                                        },
                                        {
                                            offset: 0,
                                            color: colorList[index][1]
                                        }
                                    ]);
                            }
                        },
                    },
                }]
            };

            if (option && typeof option === "object") {
                myChart.setOption(option, true);
            }
        }
    </script>
</html>

以上是关于按数值显示不同渐变颜色柱状图的主要内容,如果未能解决你的问题,请参考以下文章

在c# chart柱状图中,怎么根据数值的大小动态控制单个柱体的颜色

Echarts 柱状图横向排版颜色渐变---实现效果详解(vue+Echarts实现)

echarts柱状图怎么修改柱体的颜色

echarts 怎么设置柱状图的颜色

echarts 柱状图颜色渐变效果

echarts颜色渐变