关于TiTanic存活预测实战(建模预测)
Posted rgzngf
tags:
篇首语:本文由小常识网(cha138.com)小编为大家整理,主要介绍了关于TiTanic存活预测实战(建模预测)相关的知识,希望对你有一定的参考价值。
一、前言
今年的春节有点不同啊,肺炎挺严重的,祈福武汉,祈福全国能尽快的战胜这次的疾病,也祝愿大家身体健康,阖家欢乐,也祈福大家在新的一年里,找工作的能找份好工作,找对象的能如愿找到合适的对象。同时也祝福我自己,嘻嘻。
看到昨天和今天早上写的竟然还有人看,大年二十九和大年三十啊,努力学习的人始终都有,努力才会有机会。
二、建模预测
关于建模预测,我本来想法挺多的,里面也有很多可以说的,比如基础的逻辑回归、决策树和随机森林、SVM等的一些基础建模,还有模型参数如何选取,模型的参数调节,模型的融合以及caggle的神器xgboost等等,这样吧,我想到什么就写一些什么吧,写不到的,我会在后续的案例中补充上。
三,实战分享
加载需要的库
import pandas as pd
import numpy as np
from sklearn.model_selection import cross_val_score
from sklearn.linear_model import LogisticRegression
加载数据
df_train = pd.read_csv(‘df_train.csv‘)
df_test = pd.read_csv(‘df_test.csv‘)
pd.set_option(‘display.max_columns‘, None)#看到全部的列
筛选数据,用于建模需要的数据
regex = ‘Age_.*|SibSp*|Fare*|Sex*|Pclass*|Family_*|Parch*‘
regexS = regex + ‘|Survived‘
# regex = ‘Age_.*|SibSp*||Fare_.*|embarked_.*|Sex*|Pclass*|Family_*‘
#其实.value和as_matrix没区别,之所以这么用,是因为都了解一下嘛
y = df_train.Survived.values
X = df_train.filter(regex=regex).as_matrix()
X_test = df_test.filter(regex=regex).as_matrix()
得到筛选的列,后面会用到
columns = df_train.filter(regex=regex).columns
这样就把用于建模的基础数据有了,开始建模
逻辑回归:
model = LogisticRegression(penalty=‘l1‘,tol=1e-6,C=2.,max_iter=100)
model.fit(X,y)
cross_val_score(model, X, y, cv=5)#用于做交叉验证

查看参数和列的关系
pd.DataFrame({"coef_":model.coef_[0],‘columns‘:columns})
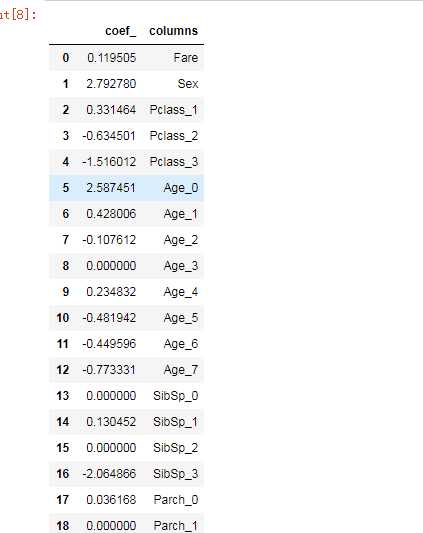
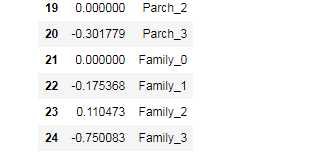
可以看到,虽然我们选取了25个特征进行拟合,但是呢,有的其实对模型没有什么用(前面参数是0的),而有的影响很小,有的影响很大,那么我们是否把影响小的特征不要了呢,或者感觉重要的参数比如Sex这一项,是否可以加大权重,而一些不重要的,是否可以把权重降低呢。
同时我们也可以看一下学习曲线如何
from sklearn.model_selection import learning_curve
import matplotlib.pyplot as plt
%matplotlib inline
plt.rcParams[‘font.sans-serif‘] = [‘SimHei‘]  # 用来正常显示中文标签
plt.rcParams[‘axes.unicode_minus‘] = False  # 用来正常显示负号
train_sizes_abs,train_scores,test_scores = learning_curve(model,X,y,train_sizes=np.linspace(.05, 1., 20))
train_scores_mean = np.mean(train_scores,axis=1)
test_scores_mean =np.mean(test_scores,axis=1)
train_scores_std = np.std(train_scores,axis=1)
test_scores_std = np.std(test_scores,axis=1)
plt.figure()
plt.title(‘曲线‘)
ylim=None
if ylim is not None:
    plt.ylim(*ylim)
plt.xlabel(u"训练样本数")
plt.ylabel(u"得分")
plt.gca().invert_yaxis()
plt.grid()

plt.fill_between(train_sizes_abs, train_scores_mean - train_scores_std, train_scores_mean + train_scores_std,
                 alpha=0.1, color="b")
plt.fill_between(train_sizes_abs, test_scores_mean - test_scores_std, test_scores_mean + test_scores_std,
                 alpha=0.1, color="r")

plt.plot(train_sizes_abs,train_scores_mean,‘o-‘, color="b", label=u"训练集上得分")
plt.plot(train_sizes_abs,test_scores_mean,‘o-‘, color="r", label=u"交叉集上得分")
plt.legend(loc="best")

plt.draw()
plt.gca().invert_yaxis()
plt.show()
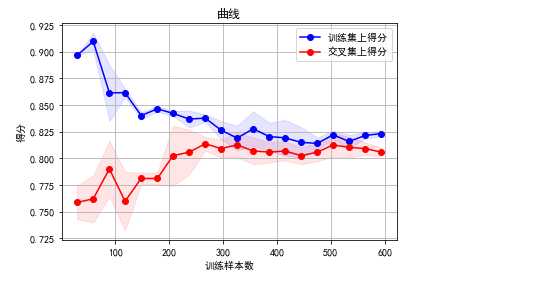
通过学习曲线,可以清晰的看到交叉验证的情况,来知道自己的模型是否过拟合,在什么程度训练的模型最好
逻辑回归有很多参数,这里的参数不一一介绍,对我我们调整模型来说,其实可调整的参数没有几个,那我们怎么来调节呢,第一个办法就是咱的笨办法,用for循环,看每次的结果;第二个就稍微高级一点,用GridSearchCV来寻找最优参数,今天大年三十,不知道时间允许不,咱先用笨办法试试喽。
可能需要调节的参数:
1、penalty惩罚项 :l1和l2两种
2、solver优化方法:
(1)liblinear:使用了开源的liblinear库实现,内部使用了坐标轴下降法来迭代优化损失函数。
(2)lbfgs:拟牛顿法的一种,利用损失函数二阶导数矩阵即海森矩阵来迭代优化损失函数。
(3)newton-cg:也是牛顿法家族的一种,利用损失函数二阶导数矩阵即海森矩阵来迭代优化损失函数。
(4)sag:即随机平均梯度下降,是梯度下降法的变种,和普通梯度下降法的区别是每次迭代仅仅用一部分的样本来计算梯度,适合于样本数据多的时候,SAG是一种线性收敛算法,这个速度远比SGD快。
注:从上面的描述可以看出,newton-cg, lbfgs和sag这三种优化算法时都需要损失函数的一阶或者二阶连续导数,因此不能用于没有连续导数的L1正则化,只能用于L2正则化。而liblinear通吃L1正则化和L2正则化。
3、正则化参数C:调整正则化强度的,也就是1中的那个
4、class_weight:参数的权重
5、multi_class:分为ovo和ovr两种,这个对于本次的二分类没啥区别
比如本次的二分类问题,应用l1正则化的情况下,可能就一个参数可调,就是正则化强度C
C = np.linspace(0.1,2,100,dtype=np.float64)
cv_score = []
for c in C:
    model = LogisticRegression(penalty=‘l1‘,tol=1e-6,C=c,max_iter=500,
                               solver=‘liblinear‘)
    model.fit(X,y)
    cv_score.append(np.mean(cross_val_score(model, X, y, cv=5)))
plt.plot(C,cv_score)
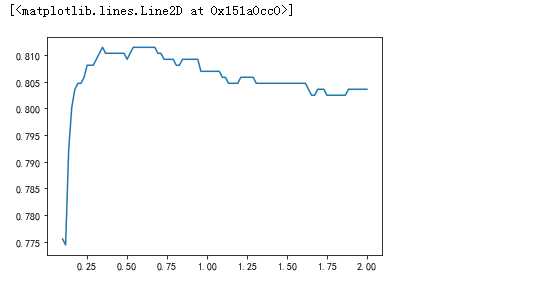
图中可以看到,应该是0.6效果差不多是最好,那么就选0.6了,选出参数来,我们需要对调好参数的模型需要做交叉验证,来看一下,咱选取的参数是否出现过拟合等。
检验自己的模型是否过拟合
from sklearn.model_selection import KFold
kf = KFold(n_splits=4,random_state=200)
cv_score_train = []
cv_score_test = []
for train_index,test_index in kf.split(X):
    X_train = X[train_index,:]
    X_test = X[test_index,:]
    y_train =  y[train_index]
    y_test = y[test_index]
    model = LogisticRegression(penalty=‘l1‘,tol=1e-6,C=0.6,max_iter=500,
                               solver=‘liblinear‘)
    model.fit(X_train,y_train)
    cv_score_test.append(np.mean(cross_val_score(model, X_test, y_test, cv=5)))
    cv_score_train.append(np.mean(cross_val_score(model, X_train, y_train, cv=5)))
plt.plot([0,1,2,3],cv_score_train,‘r‘,label = u‘训练集上得分‘)
plt.plot([0,1,2,3],cv_score_test,‘b‘,label = u‘测试集上得分‘)
plt.legend()
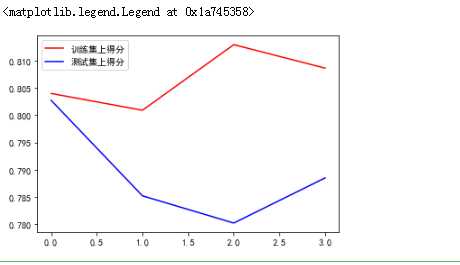
感觉还差一些
C = np.linspace(0.1,5,200,dtype=np.float64)
cv_score_test = []
cv_score_train = []
for c in C:
    kf = KFold(n_splits=4,random_state=200)
    cv_score_train_kf = []
    cv_score_test_kf = []
    for train_index,test_index in kf.split(X):
        X_train = X[train_index,:]
        X_test = X[test_index,:]
        y_train =  y[train_index]
        y_test = y[test_index]
        model = LogisticRegression(penalty=‘l1‘,tol=1e-6,C=c,max_iter=500,
                                   solver=‘liblinear‘)
        model.fit(X_train,y_train)
        cv_score_test_kf.append(np.mean(cross_val_score(model, X_test, y_test, cv=5)))
        cv_score_train_kf.append(np.mean(cross_val_score(model, X_train, y_train, cv=5)))
    cv_score_test.append (np.mean(cv_score_test_kf))
    cv_score_train.append( np.mean(cv_score_train_kf))


plt.figure()
plt.title(‘曲线‘)
plt.plot(C,cv_score_test,‘r‘,label=u‘测试集上得分‘)
plt.plot(C,cv_score_train,‘b‘,label=u‘训练集上得分‘)
plt.legend(loc="best")

plt.show()
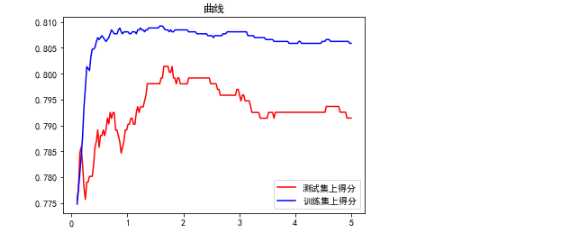
看这个图貌似1.6貌似靠谱一些啊,两个交叉验证是有区别的,一个是全部数据集去训练拟合,再拿他们去做交叉验证,后面的是先拿一部分数据去做训练拟合,另外的数据去做交叉验证,下面的更靠谱一些,参数应该选1.6左右最好。
快吃年夜饭了,不写了,就先这样吧,在这里,再次祝福大家新年快乐,在新的一年里事业有成,阖家欢乐,心想事成。
以上是关于关于TiTanic存活预测实战(建模预测)的主要内容,如果未能解决你的问题,请参考以下文章