Tensorflow机器学习入门——网络可视化TensorBoard
Posted fengqiao
tags:
篇首语:本文由小常识网(cha138.com)小编为大家整理,主要介绍了Tensorflow机器学习入门——网络可视化TensorBoard相关的知识,希望对你有一定的参考价值。
一、在代码中给变量和操作命名并输出Graph到指定的文件夹
import tensorflow as tf
import numpy as np
import matplotlib.pyplot as plt
import os
#设置当前工作目录
os.chdir(r‘H:NotepadTensorflow‘)

def add_layer(inputs, in_size, out_size, activation_function=None):
    with tf.name_scope(‘layer‘):#命名
        with tf.name_scope(‘weights‘):
            Weights = tf.Variable(tf.random_normal([in_size, out_size]), name=‘W‘)
        with tf.name_scope(‘biases‘):
            biases = tf.Variable(tf.zeros([1, out_size]) + 0.1, name=‘b‘)
        with tf.name_scope(‘Wx_plus_b‘):
            Wx_plus_b = tf.add(tf.matmul(inputs, Weights), biases)
        if activation_function is None:
            outputs = Wx_plus_b
        else:
            outputs = activation_function(Wx_plus_b, )
        return outputs

#数据
x_data = np.linspace(-1,1,300)[:, np.newaxis]
noise = np.random.normal(0, 0.05, x_data.shape)
y_data = 5*np.square(x_data) - 0.5 + noise

#输入
with tf.name_scope(‘inputs‘):
    xs = tf.placeholder(tf.float32, [None, 1], name=‘x_input‘)
    ys = tf.placeholder(tf.float32, [None, 1], name=‘y_input‘)

#3层网络
l1 = add_layer(xs, 1, 10, activation_function=tf.nn.relu)
l2 = add_layer(l1, 10, 10, activation_function=tf.nn.relu)
prediction = add_layer(l2, 10, 1, activation_function=None)

#损失与训练
with tf.name_scope(‘loss‘):
    loss = tf.reduce_mean(tf.reduce_sum(tf.square(ys - prediction),
                                        reduction_indices=[1]))
with tf.name_scope(‘train‘):
    train_step = tf.train.GradientDescentOptimizer(0.1).minimize(loss)

# plot the real data
fig = plt.figure()
ax = fig.add_subplot(1,1,1)
ax.scatter(x_data, y_data)
plt.ion()
plt.show()
#运行
init = tf.global_variables_initializer()
with tf.Session() as sess:
    writer = tf.summary.FileWriter("logs/", sess.graph)#输出Graph
    sess.run(init)
    for i in range(100000):
        # training
        sess.run(train_step, feed_dict={xs: x_data, ys: y_data})
        if i % 50 == 0:
            try:
                ax.lines.remove(lines[0])
            except Exception:
                pass
            prediction_value = sess.run(prediction, feed_dict={xs: x_data})
            # plot the prediction
            lines = ax.plot(x_data, prediction_value, ‘r-‘, lw=5)
            plt.pause(1)
二、在log文件夹所在目录打开cmd,并输入‘ tensorboard --logdir=logs ’
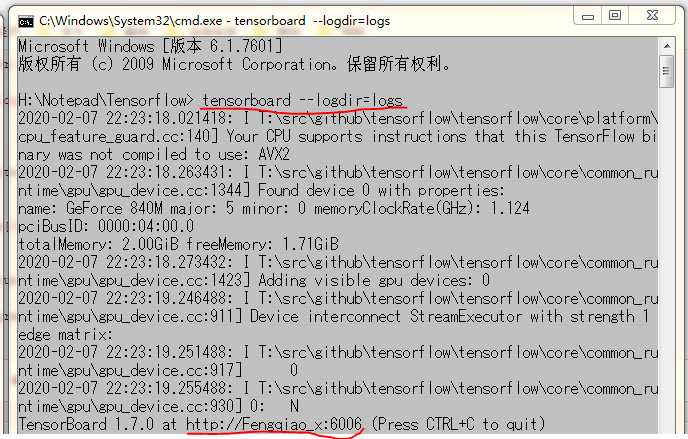
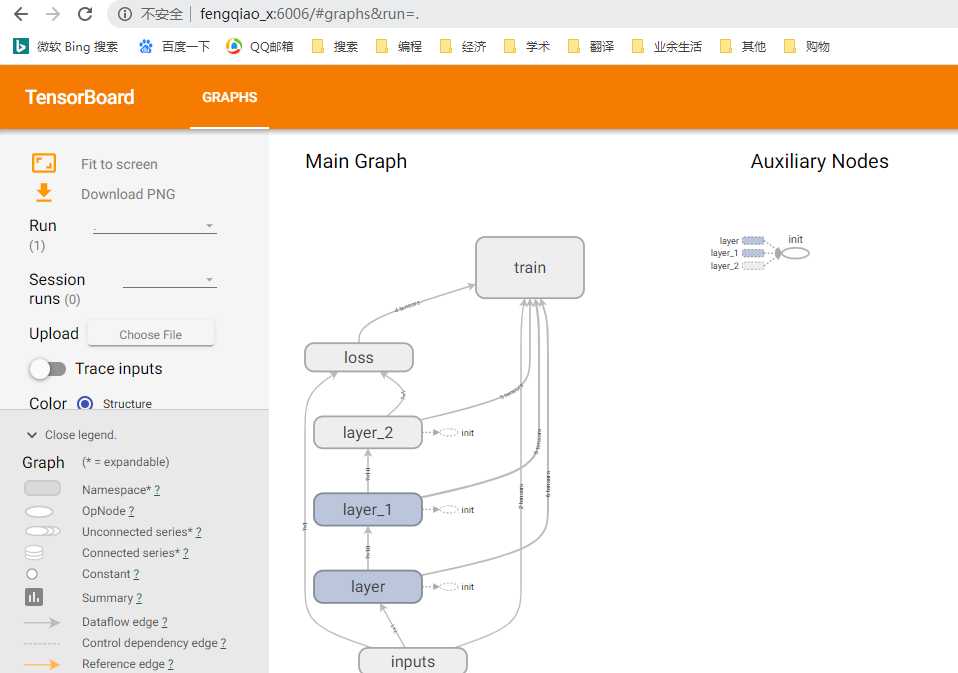
三、在Google Chrome浏览器中输入cmd中给出的网址
以上是关于Tensorflow机器学习入门——网络可视化TensorBoard的主要内容,如果未能解决你的问题,请参考以下文章