Marginal likelihood
Posted eliker
tags:
篇首语:本文由小常识网(cha138.com)小编为大家整理,主要介绍了Marginal likelihood相关的知识,希望对你有一定的参考价值。
The marginal likelihood is the integral of the likelihood times the prior
$$ p(y|X) = int p(y| f, X) p(f | X) df $$
The term marginal likelihood refers to the marginalization over the function value $f$. Under the Gaussian process model the prior is Gaussian, $f sim mathcal N(0, K)$, or
$$ ext{log}p(f|X) = -frac{1}{2} f^T K^{-1} f – frac{1}{2} ext{log} |K| – frac{n}{2} ext{log} 2pi $$
and the likelihood is a factorized Gaussian $y|f sim mathcal N (f, sigma_n^2 I)$, so we can perform the integration yielding the log marginal likehood.
$$ ext{log}p(y|X) = -frac{1}{2}y^T (K + sigma_n^2 I)^{-1} y – frac{1}{2} ext{log} |K + sigma_n^2 I| – frac{n}{2} ext{log} 2pi $$
This result can also be obtained directly by observing that $y sim mathcal N(0, K + sigma_n^2 I)$
2. Hyperparameters
Typically the covariance function that we used will have some free parameters. For example, the squared-exponential covariance function in one dimension has the following form
$$ k(x_p,x_q) = sigma_f^2 ext{exp} (frac{1}{2l^2}(x_p-x_q)^2) + sigma_n^2 delta_{pq} $$
Observe that the length-scale $l$, the signal variance $sigma_f^2$ and the noise variance $sigma_n^2$ can be varied. In general, we call the free parameters hyperparameters.
So, we can sweep this parameter to get a best regression result.
2.1 sweep length scale
N means the number of training sample.
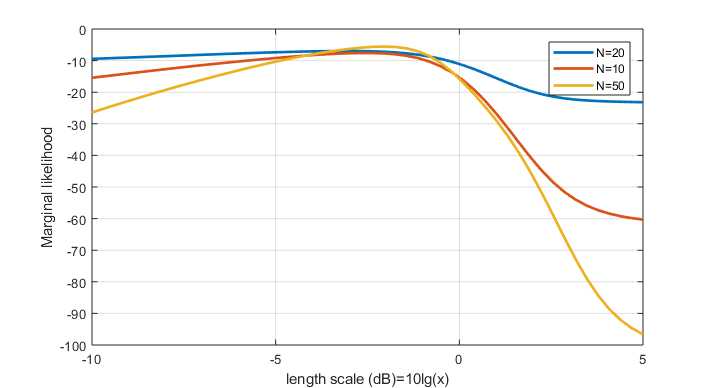
https://github.com/elike-ypq/Gaussian_Process/blob/master/sweep_length_scale.m
2.2 sweep length scale $l$ and noise level ($sigma_n^2$)
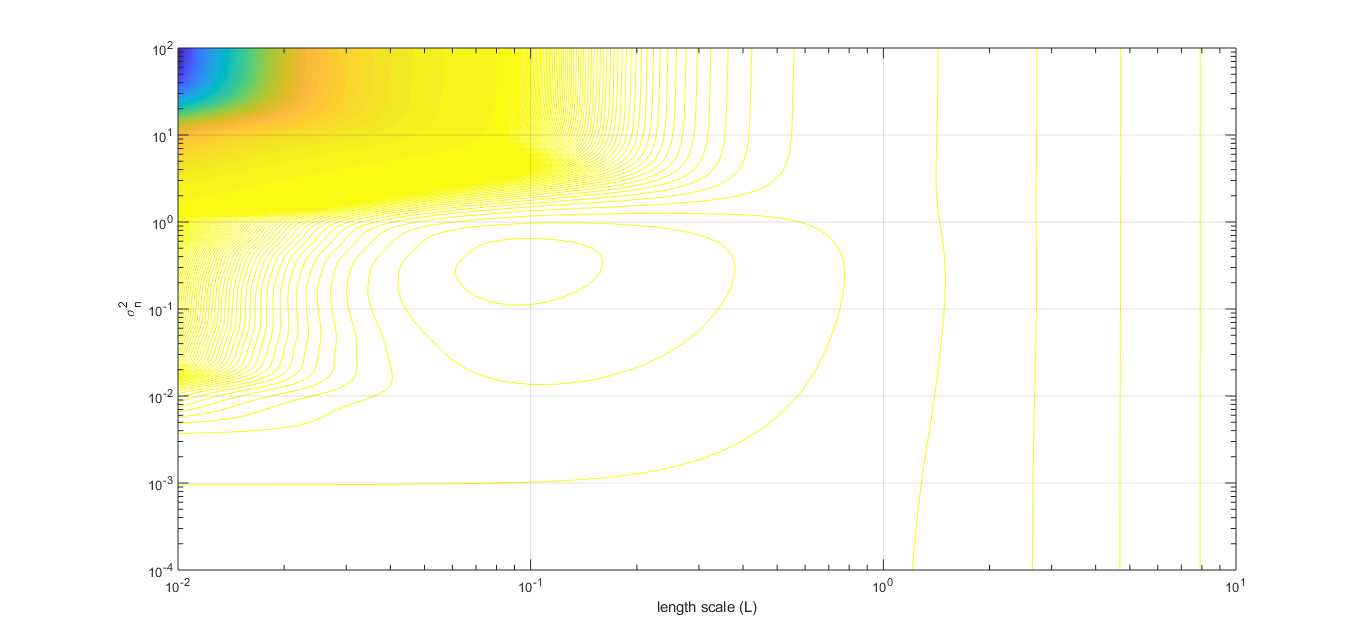
https://github.com/elike-ypq/Gaussian_Process/blob/master/sweep_length_scale_n_sigma_3D.m
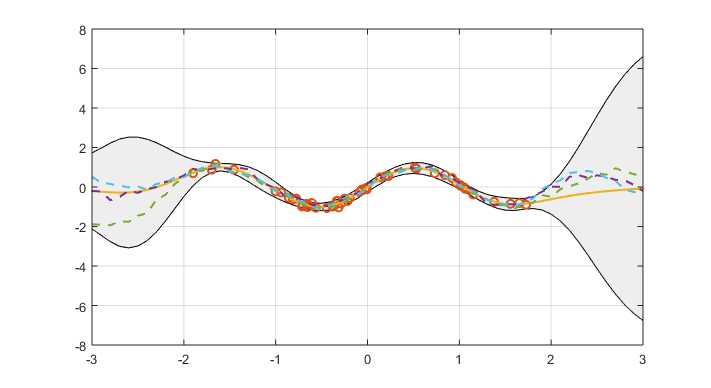
From above picture, the optimum value of $l$ and $sigma_n^2$ for this regression is calculated out. And the best regression is shown as following
以上是关于Marginal likelihood的主要内容,如果未能解决你的问题,请参考以下文章