数据可视化-py
Posted g2thend
tags:
篇首语:本文由小常识网(cha138.com)小编为大家整理,主要介绍了数据可视化-py相关的知识,希望对你有一定的参考价值。
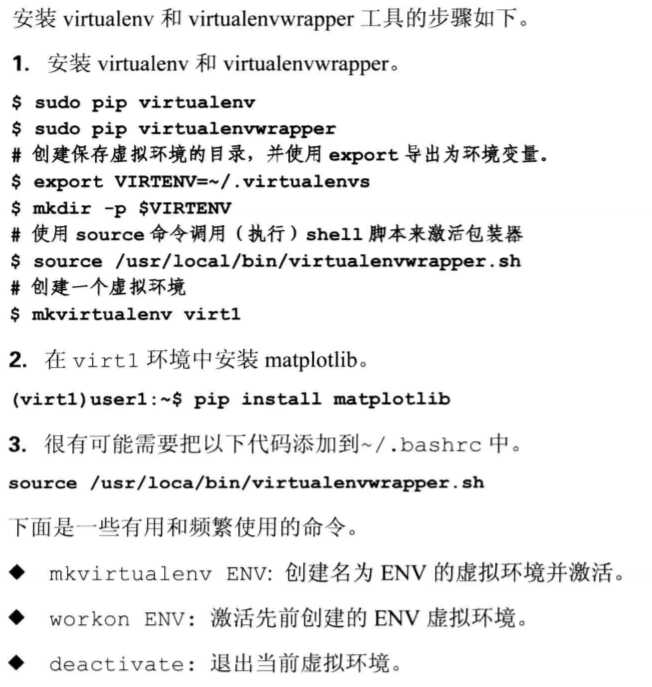
环境准备
虚拟环境

matplotlib文档
实验
体验
#1
from matplotlib  import pyplot as  plt
x = range(2,26,2)
y = [15,13,14.5,17,20,25,26,26,24,22,18,15]
plt.figure(figsize=(20,8),dpi=80)
plt.rc("lines", linewidth=2, color='g')
plt.plot(x, y)
plt.xticks(range(2,25))
plt.show()

#2 饼图
import numpy  as np
from matplotlib  import pyplot as  plt
t = np.arange(0.0, 1.0, 0.01)
s = np.sin(2 * np.pi * t)
plt.rcParams['lines.color'] = 'r'
plt.plot(t, s)
c  = np.cos(2 * np.pi * t)
plt.rcParams['lines.linewidth'] = '3'
plt.plot(t,c)
plt.show()


#3 正反余弦
import numpy  as np
t = np.arange(0.0, 1.0, 0.01)
s = np.sin(2 * np.pi * t)
plt.rcParams['lines.color'] = 'r'
plt.plot(t, s)
c = np.cos(2 * np.pi * t)
plt.rcParams['lines.linewidth'] = '3'
plt.plot(t,c)
plt.show()
以上是关于数据可视化-py的主要内容,如果未能解决你的问题,请参考以下文章