use matplotlib to draw scatter plot
Posted guoendlesslove
tags:
篇首语:本文由小常识网(cha138.com)小编为大家整理,主要介绍了use matplotlib to draw scatter plot相关的知识,希望对你有一定的参考价值。
There are many pionts in this kind of table.
How to do it? We can use scatter() to draw it.
Code:
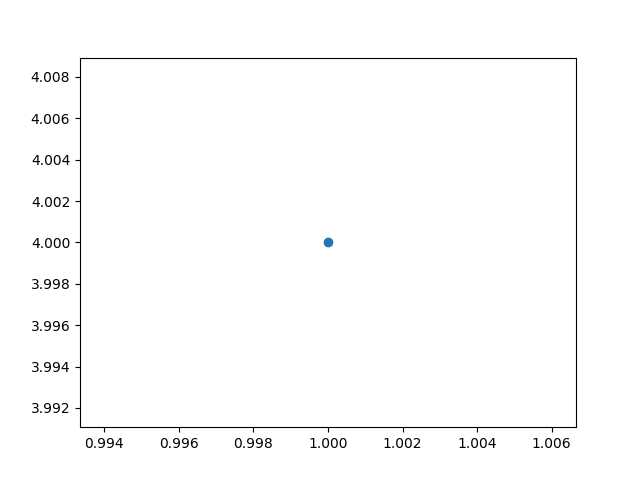
import matplotlib.pyplot as plt
plt.scatter(1,4)
plt.show()
The result :
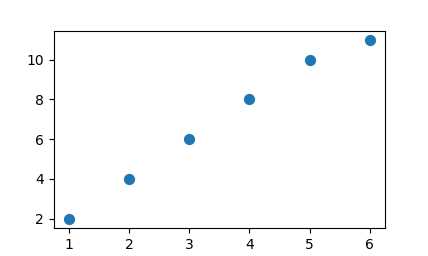
now,we can use scatter() to draw many pionts.Just like this:
code:
import matplotlib.pyplot as plt
x=[1,2,3,4,5,6]
y=[2,4,6,8,10,11]
plt.scatter(x,y,s=50)
plt.show()
以上是关于use matplotlib to draw scatter plot的主要内容,如果未能解决你的问题,请参考以下文章