某服装品牌销售数据分析
Posted ohou
tags:
篇首语:本文由小常识网(cha138.com)小编为大家整理,主要介绍了某服装品牌销售数据分析相关的知识,希望对你有一定的参考价值。
1.背景&目标问题
根据某服装品牌的销售数据,利用Python进行可视化,并解决如下问题:
整体销售情况随着时间的变化是怎样的?
不同产品的销售情况是怎样的?顾客偏爱哪一种购买方式?
销售额和产品成本之间的关系怎么样?
2. 数据简介
包含字段:
store_id:门店ID
city:所在城市
channel:渠道,线上/线下
gender_group:性别分组
age_group:年龄段
wkd_ind:周中or周末
product:产品类型
customer:顾客人数
revenue:销售金额
order:订单
quant:销售数量
unit_cost:单件产品成本
3.分析
1.导入数据和数据库
import pandas as pd
import matplotlib.pyplot as plt
%matplotlib inline
import seaborn as sns
%matplotlib inline # 可以在Ipython编译器里直接使用,功能是可以内嵌绘图,并且可以省略掉plt.show()这一步
plt.rcParams['font.sans-serif'] = ['SimHei']  # 中文字体设置-黑体
plt.rcParams['axes.unicode_minus'] = False  # 解决保存图像是负号'-'显示为方块的问题
sns.set(font='SimHei')  # 解决Seaborn中文显示问题
data = pd.read_csv(r'C:/Users/pc/Desktop/mydata.csv')
data.tail()| store_id | city | channel | gender_group | age_group | wkd_ind | product | customer | revenue | order | quant | unit_cost | |
|---|---|---|---|---|---|---|---|---|---|---|---|---|
| 22288 | 146 | 杭州 | 线下 | Female | 30-34 | Weekday | 短裤 | 1 | 80.0 | 1 | 2 | 19 |
| 22289 | 430 | 成都 | 线下 | Female | 25-29 | Weekend | T恤 | 1 | 79.0 | 1 | 1 | 49 |
| 22290 | 449 | 武汉 | 线下 | Female | 35-39 | Weekday | T恤 | 1 | 158.0 | 1 | 2 | 49 |
| 22291 | 758 | 杭州 | 线下 | Female | 20-24 | Weekday | 袜子 | 1 | 26.0 | 1 | 1 | 9 |
| 22292 | 616 | 成都 | 线下 | Male | 30-34 | Weekday | 当季新品 | 1 | 79.0 | 1 | 1 | 59 |
2.清洗和整理数据
2.1 检查缺失值
data.isnull().any()store_id False
city False
channel False
gender_group False
age_group False
wkd_ind False
product False
customer False
revenue False
order False
quant False
unit_cost False
dtype: booldata.info()<class 'pandas.core.frame.DataFrame'>
RangeIndex: 22293 entries, 0 to 22292
Data columns (total 12 columns):
store_id 22293 non-null int64
city 22293 non-null object
channel 22293 non-null object
gender_group 22293 non-null object
age_group 22293 non-null object
wkd_ind 22293 non-null object
product 22293 non-null object
customer 22293 non-null int64
revenue 22293 non-null float64
order 22293 non-null int64
quant 22293 non-null int64
unit_cost 22293 non-null int64
dtypes: float64(1), int64(5), object(6)
memory usage: 2.0+ MB2.2 查看和整理revenue
data.revenue.describe()count 22293.000000
mean 159.531371
std 276.254066
min -0.660000
25% 64.000000
50% 99.000000
75% 175.000000
max 12538.000000
Name: revenue, dtype: float64data = data[data.revenue > 0]
data.revenue.describe()count 22262.000000
mean 159.753549
std 276.382135
min 10.000000
25% 66.000000
50% 99.000000
75% 175.000000
max 12538.000000
Name: revenue, dtype: float642.3 去除离散值
data2 = data[data['revenue'] < 2000]
data2.revenue.describe()
count 22200.000000
mean 149.833600
std 171.650825
min 10.000000
25% 65.000000
50% 99.000000
75% 168.447500
max 1990.000000
Name: revenue, dtype: float64问题一:整体销售情况随着时间的变化是怎样的?
plt.figure(figsize=(10,10))

plt.subplot(221)
sns.barplot(x='wkd_ind', y='revenue', data=data2)

plt.subplot(222)
sns.countplot(x='wkd_ind', data=data2)

plt.subplot(223)
sns.barplot(x='wkd_ind', y='quant', data=data2)

plt.subplot(224)
sns.barplot(x='wkd_ind', y='customer', data=data2)

plt.subplots_adjust(wspace =0.5, hspace =0.5)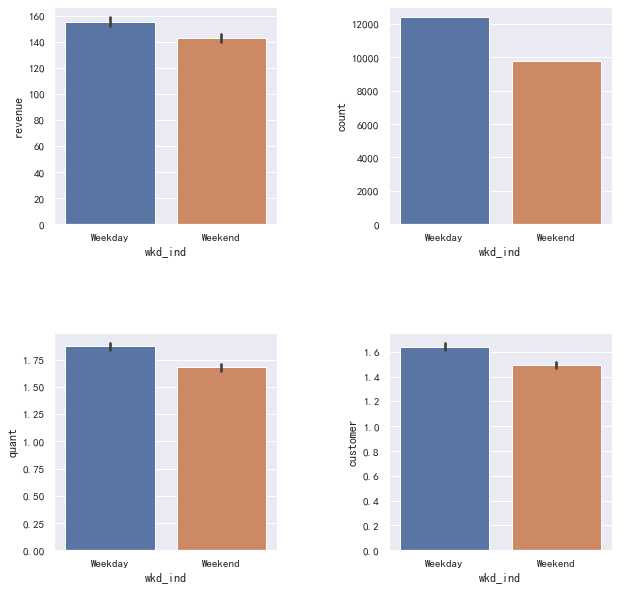
从销售额和交易次数与时间的关系图可以发现,工作日的总交易次数和平均销售额都略高于周末。
工作日每笔订单的商品数量和消费者数量也都略高于周日。
问题二:不同产品的销售情况是怎样的?顾客偏爱哪一种购买方式?
plt.figure(figsize=(15,6))

plt.subplot(121)
sns.barplot(x='product', y='revenue', data=data2)

plt.subplot(122)
data2['product'].value_counts().plot(kind='bar', rot=45)


plt.subplots_adjust(wspace =0.5, hspace =0.5)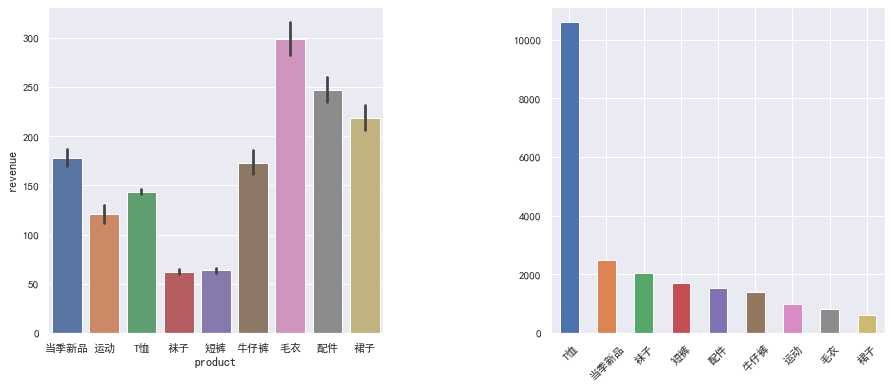
各个商品种类的平均销售额和交易次数分布图,可以看出T袖占了主要份额,而毛衣、配件和裙子的平均销售额较高
data2.gender_group.describe()count 22200
unique 3
top Female
freq 14124
Name: gender_group, dtype: objectdata2.gender_group.unique()array(['Female', 'Male', 'Unkown'], dtype=object)# 去除性别不详部分
data3 = data2[data2['gender_group'] != 'Unkown']
data3.gender_group.unique()array(['Female', 'Male'], dtype=object)plt.figure(figsize=(10,5))
plt.subplot(121)
sns.countplot(x='gender_group', hue='channel', data=data3)
plt.subplot(122)
sns.barplot(x='gender_group', y='revenue',hue='channel', data=data3)
plt.subplots_adjust(wspace =0.5, hspace =0.5)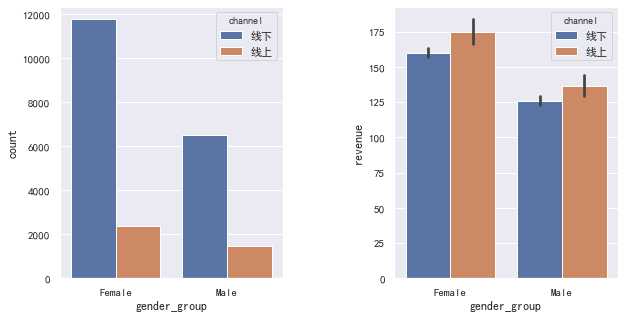
线下交易数量远远大于线上,女性和男性都普遍喜欢线下交易,但线上交易的销售额都略高于线下
# 检查城市列数据

data2.city.describe()
count 22200
unique 10
top 深圳
freq 4347
Name: city, dtype: objectdata2.city.isnull().any()Falseplt.figure(figsize=(13,5))
sns.countplot(x='city', hue='channel', data=data2)<matplotlib.axes._subplots.AxesSubplot at 0x17c7ed7b748>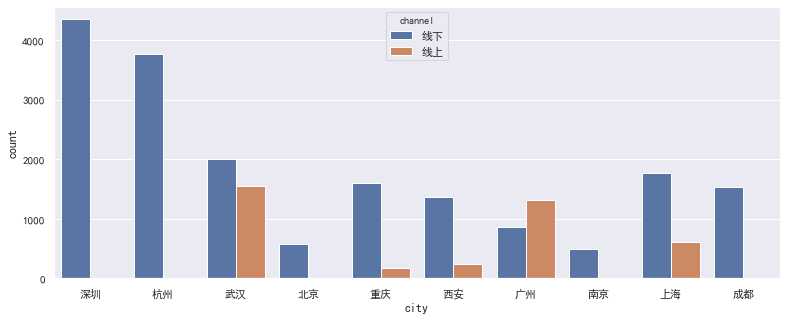
plt.figure(figsize=(13,5))
sns.barplot(x='city',y='revenue', hue='channel', data=data2)
<matplotlib.axes._subplots.AxesSubplot at 0x17c7f0959e8>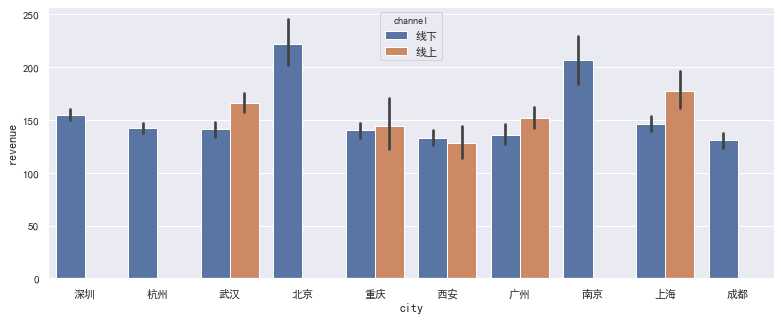
没有深圳、杭州、北京、南京和成都的线上数据,首先需要确认数据来源是否可靠,找出缺失原因和相应的对策。
从已有的数据可以看出,深圳和杭州的交易数量遥遥领先,重庆、西安和上海的线下交易次数远高于线上,而广州则相反。
而从交易额的角度看,线上交易额都略高于线下
plt.figure(figsize=(13,5))
sns.countplot(x='age_group', hue='channel', data=data2)
<matplotlib.axes._subplots.AxesSubplot at 0x17c7ecb5470>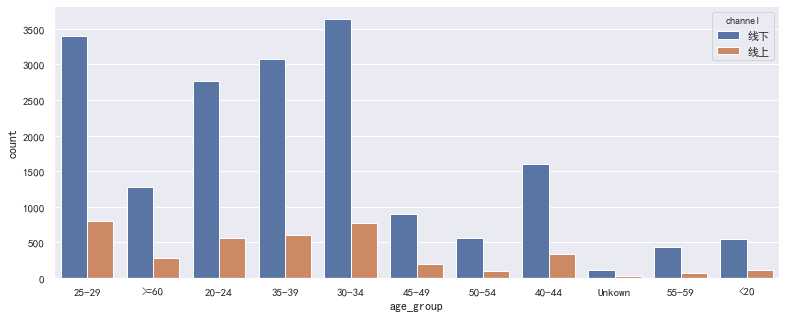
plt.figure(figsize=(13,5))
sns.barplot(x='age_group',y='revenue', hue='channel', data=data2)
<matplotlib.axes._subplots.AxesSubplot at 0x17c7d7232e8>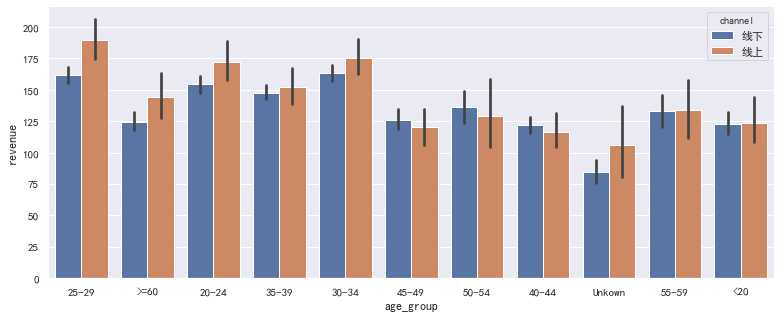
从年龄的角度看,该品牌的线上和线下交易量都主要集中在 25-40 岁之间,这部分顾客的线上交易额都略高于线下;
而 40 岁以上的顾客,则相反
问题三:销售额和产品成本之间的关系怎么样?
# 构造价格列
data2['price'] = data2['revenue'] / data2['quant']

# 构造价差列
data2['margin'] = data2['price'] - data2['unit_cost']
data2.head()| store_id | city | channel | gender_group | age_group | wkd_ind | product | customer | revenue | order | quant | unit_cost | price | margin | |
|---|---|---|---|---|---|---|---|---|---|---|---|---|---|---|
| 0 | 658 | 深圳 | 线下 | Female | 25-29 | Weekday | 当季新品 | 4 | 796.0 | 4 | 4 | 59 | 199.000000 | 140.000000 |
| 1 | 146 | 杭州 | 线下 | Female | 25-29 | Weekday | 运动 | 1 | 149.0 | 1 | 1 | 49 | 149.000000 | 100.000000 |
| 2 | 70 | 深圳 | 线下 | Male | >=60 | Weekday | T恤 | 2 | 178.0 | 2 | 2 | 49 | 89.000000 | 40.000000 |
| 3 | 658 | 深圳 | 线下 | Female | 25-29 | Weekday | T恤 | 1 | 59.0 | 1 | 1 | 49 | 59.000000 | 10.000000 |
| 4 | 229 | 深圳 | 线下 | Male | 20-24 | Weekend | 袜子 | 2 | 65.0 | 2 | 3 | 9 | 21.666667 | 12.666667 |
data2.margin.describe()count 22200.000000
mean 38.066968
std 39.933991
min -86.000000
25% 14.000000
50% 30.000000
75% 50.000000
max 270.000000
Name: margin, dtype: float64plt.figure(figsize=(13,5))
sns.barplot(x='margin',y='product', data=data2)<matplotlib.axes._subplots.AxesSubplot at 0x17c7f17da58>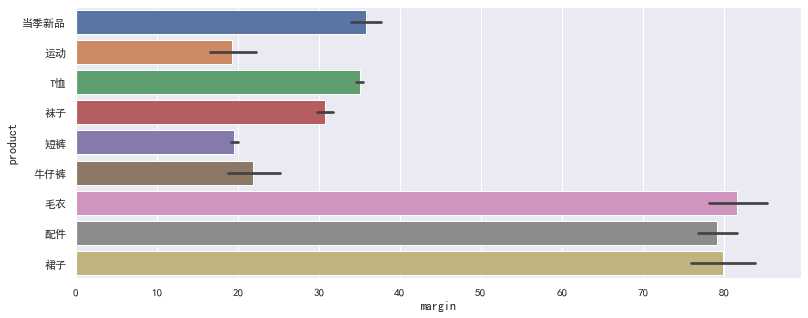
毛衣、配件和裙子的平均利润远高于其他商品,运动、短裤和牛仔裤是相对利润较低的
bins = [-100, -50, 0, 50, 100, 150, 200]
labels = ['<-50', '<0', '<50', '<100', '<150', '<200']
data2['margin_range'] = pd.cut(data2.margin, bins=bins, right=False, labels=labels)
data2.groupby(['margin_range'])['product'].describe()| count | unique | top | freq | |
|---|---|---|---|---|
| margin_range | ||||
| <-50 | 13 | 2 | 毛衣 | 8 |
| <0 | 2773 | 7 | 牛仔裤 | 820 |
| <50 | 11016 | 9 | T恤 | 5754 |
| <100 | 6270 | 9 | T恤 | 3839 |
| <150 | 1658 | 7 | 当季新品 | 327 |
| <200 | 399 | 4 | 配件 | 148 |
plt.figure(figsize=(8,5))
sns.countplot(x='margin_range', data=data2)
<matplotlib.axes._subplots.AxesSubplot at 0x17c7f32b630>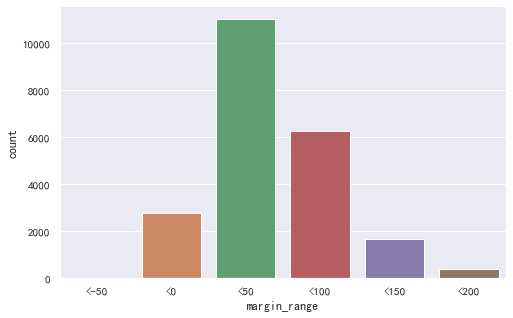
根据利润对数据进行分组,可以看出,亏损商品主要来源于牛仔裤和毛衣,而T恤的销量最高,单件利润集中在 0-100 元之间,应该是该品牌的利润的中坚力量
q3 = ['margin', 'revenue', 'unit_cost']
data2[q3].corr()| margin | revenue | unit_cost | |
|---|---|---|---|
| margin | 1.000000 | 0.444482 | 0.104207 |
| revenue | 0.444482 | 1.000000 | 0.223847 |
| unit_cost | 0.104207 | 0.223847 | 1.000000 |
sns.heatmap(data2[q3].corr())<matplotlib.axes._subplots.AxesSubplot at 0x17c7d785be0>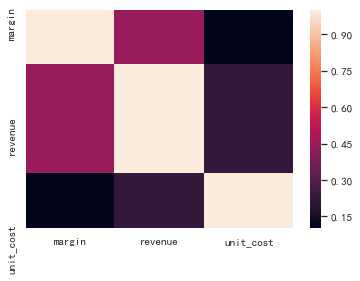
利润和销售额成正相关,且相关性较强,虽然利润与成本也呈正相关,但相关性较弱。
以上是关于某服装品牌销售数据分析的主要内容,如果未能解决你的问题,请参考以下文章