SciPy - 正态性 与 KS 检验
Posted yanshw
tags:
篇首语:本文由小常识网(cha138.com)小编为大家整理,主要介绍了SciPy - 正态性 与 KS 检验相关的知识,希望对你有一定的参考价值。
假设检验的基本思想
若对总体的某个假设是真实的,那么不利于或者不能支持这一假设的事件A在一次试验中是几乎不可能发生的;如果事件A真的发生了,则有理由怀疑这一假设的真实性,从而拒绝该假设;
假设检验实质上是对原假设是否正确进行检验,因此检验过程中要使原假设得到维护,使之不轻易被拒绝;否定原假设必须有充分的理由。同时,当原假设被接受时,也只能认为否定该假设的根据不充分,而不是认为它绝对正确
ks 检验
ks 检验分为 单样本 和两样本 检验;
单样本检验 用于 检验 一个数据的观测分布 是否符合 某种理论分布;
两样本检验 用于检验 两个样本是否 属于 同一分布,ks 检验 是 两样本检验最有用且最常用的非参数方法之一;
ks 检验 不仅能检验正态分布,还能检验其他分布;
def kstest(rvs, cdf, args=(), N=20, alternative=‘two-sided‘, mode=‘approx‘):
    """
    Parameters
    ----------
    rvs : str, array_like, or callable
        If a string, it should be the name of a distribution in `scipy.stats`.
        If an array, it should be a 1-D array of observations of random
        variables.
        If a callable, it should be a function to generate random variables;
        it is required to have a keyword argument `size`.
    Returns
    -------
    statistic : float
        KS test statistic, either D, D+ or D-.
    pvalue :  float
        One-tailed or two-tailed p-value.
    """
rvs:待检验的数据,1-D 数组
cdf:待检验的分布,如 norm 正态检验
alternative:默认为双尾检验,可以设置为‘less’或‘greater’作单尾检验
statistic:统计结果
pvalue:p 值 越大,越支持原假设,一般会和指定显著水平 5% 比较,大于 5%,支持原假设;【支持原假设无法否定原假设,不代表原假设绝对正确】
单样本检验
######### 非正态 #########
x1 = np.linspace(-15, 15, 9)
print(kstest(x1, ‘norm‘))
# KstestResult(statistic=0.4443560271592436, pvalue=0.03885014270517116)  <0.05

######### 正态 #########
np.random.seed(1000)
x2 = np.random.randn(100)
print(kstest(x2, ‘norm‘))
# KstestResult(statistic=0.06029093862878099, pvalue=0.8604070909241421)   >0.05

#### 同一个数据(服从正态分布),不同的参数有截然不同的检测结果,说明 ks 检测 正态性 比较麻烦
x3 = np.random.normal(100, 0.01, 1000)
print(kstest(x3, ‘norm‘))
# KstestResult(statistic=1.0, pvalue=0.0)           <0.05
print(kstest(x3, ‘norm‘, alternative=‘greater‘))
# KstestResult(statistic=0.0, pvalue=1.0)           >0.05
两样本检验
import numpy as np
from scipy.stats import ks_2samp, kstest

beta=np.random.beta(7, 5, 1000)
norm=np.random.normal(0, 1, 1000)
print(ks_2samp(beta, norm))
# Ks_2sampResult(statistic=0.578, pvalue=7.844864182954565e-155)

# p-value比指定的显著水平(假设为5%)小,则我们完全可以拒绝假设:beta和norm不服从同一分布
shapiro 正态检验
专门做 正态检验 的模块
shapiro 不适合做样本数>5000的正态性检验,检验结果的P值可能不准确
def shapiro(x):
    """
    Parameters
    ----------
    x : array_like
        Array of sample data.

    Returns
    -------
    W : float
        The test statistic.
    p-value : float
        The p-value for the hypothesis test.
    """
######### 非正态 #########
x = np.random.rand(100)
print(stats.shapiro(x))
# (0.9387611746788025, 0.00016213695926126093)   <0.05

######### 正态 #########
x1 = stats.norm.rvs(loc=5, scale=3, size=100)
print(stats.shapiro(x1))
# (0.9818177223205566, 0.18372832238674164)     >0.05

np.random.seed(1000)
x2 = np.random.randn(100)
print(stats.shapiro(x2))
# (0.9930729269981384, 0.89242023229599)        >0.05

#### 同样的数据,ks 检测 非正态,shapiro 检测 正态
x3 = np.random.normal(100, 0.01, 1000)
print(stats.shapiro(x3))
# (0.9976787567138672, 0.17260634899139404)     >0.05
normaltest
也是专门做 正态检测 的模块
def normaltest(a, axis=0, nan_policy=‘propagate‘):
    """
    Parameters
    ----------
    a : array_like
        The array containing the sample to be tested.
    Returns
    -------
    statistic : float or array
    pvalue : float or array
       A 2-sided chi squared probability for the hypothesis test.
    """
######### 非正态 #########
x = np.random.rand(100)
print(normaltest(x))
# NormaltestResult(statistic=17.409796250892015, pvalue=0.00016577184786199797) <0.05

######### 正态 #########
x1 = np.random.randn(10, 20)
print(normaltest(x1, axis=None))
#NormaltestResult(statistic=1.8245865103063612, pvalue=0.4016021909152733)  >0.05

np.random.seed(1000)
x2 = np.random.randn(100)
print(normaltest(x2))
# NormaltestResult(statistic=1.2417269613653144, pvalue=0.5374801334521462)       >0.05


#### 同样的数据,ks 检测 非正态,shapiro 检测 正态, normaltest 检测 正态
x3 = np.random.normal(100, 0.01, 1000)
print(normaltest(x3))
# NormaltestResult(statistic=3.3633106484154944, pvalue=0.18606572188584633)    >0.05
anderson
增强版的 ks 检测
def anderson(x, dist=‘norm‘):
    """
    Anderson-Darling test for data coming from a particular distribution.
    x : array_like
        Array of sample data.
    dist : {‘norm‘,‘expon‘,‘logistic‘,‘gumbel‘,‘gumbel_l‘, gumbel_r‘,
        ‘extreme1‘}, optional
        the type of distribution to test against.  The default is ‘norm‘
        and ‘extreme1‘, ‘gumbel_l‘ and ‘gumbel‘ are synonyms.

    Returns
    -------
    statistic : float
        The Anderson-Darling test statistic.
    critical_values : list
        The critical values for this distribution.
    significance_level : list
        The significance levels for the corresponding critical values
        in percents.  The function returns critical values for a
        differing set of significance levels depending on the
        distribution that is being tested against.
    """
anderson 有三个输出值,第一个为统计数,第二个为评判值,第三个为显著性水平,
评判值与显著性水平对应,
对于正态性检验,显著性水平为:15%, 10%, 5%, 2.5%, 1%
# If the returned statistic is larger than these critical values then for the corresponding significance level,
# the null hypothesis that the data come from the chosen distribution can be rejected.
######### 非正态 #########
x1 = np.random.rand(100)
print(anderson(x1))
# AndersonResult(statistic=2.297910919361925, critical_values=array([0.555, 0.632, 0.759, 0.885, 1.053]), significance_level=array([15. , 10. ,  5. ,  2.5,  1. ]))
### 统计数 大于 评判值,拒绝假设,非正态

######### 正态 #########
x2 = np.random.randn(100)
print(anderson(x2))
# AndersonResult(statistic=0.35148092757619054, critical_values=array([0.555, 0.632, 0.759, 0.885, 1.053]), significance_level=array([15. , 10. ,  5. ,  2.5,  1. ]))
### 统计数 小于 评判值,正态

#### 同样的数据,ks 检测 非正态,shapiro 检测 正态
np.random.seed(1000)
x3 = np.random.normal(100, 0.01, 1000)
print(anderson(x3))
# AndersonResult(statistic=0.201867508676969, critical_values=array([0.574, 0.653, 0.784, 0.914, 1.088]), significance_level=array([15. , 10. ,  5. ,  2.5,  1. ]))
### 统计数 小于 评判值,正态
Q-Q 图
QQ 图功能很多,本文仅介绍如何使用它进行 正态性检测
import numpy as np
import matplotlib.pyplot as plt
import scipy.stats as st

fig, axs = plt.subplots(3, 1)

######### 非正态 #########
x1 = np.random.randint(1, 100, 100)
st.probplot(x1, plot=axs[0])

######### 正态 #########
np.random.seed(1000)
x2 = np.random.randn(100)
st.probplot(x2, plot=axs[1])

#### ks 检验非正态,看看 qq 图
x3 = np.random.normal(100, 0.01, 1000)
st.probplot(x3, plot=axs[2])

plt.show()
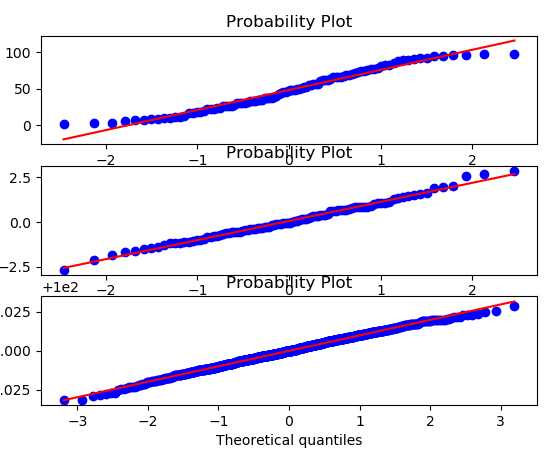
输出:图 1 为 非正态,图 2 3 为正态

红色线条表示正态分布,蓝色线条表示样本数据,蓝色越接近红色参考线,说明越符合预期分布(这是是正态分布)
正态化处理
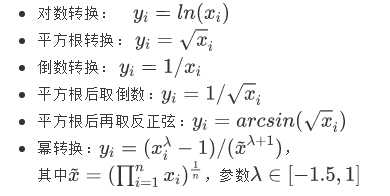
在做回归分析时,经常需要 把 非正态 数据 转换成 正态 数据,方法如下

在一些情况下(P值<0.003)上述方法很难实现正态化处理,此时可使用 BOX-COX 转换,但是当P值>0.003时两种方法均可,优先考虑普通的平方变换

boxcox 示例
from scipy.stats import kstest, shapiro
from scipy.stats import boxcox
import matplotlib.pyplot as plt
from scipy import stats

fig, axs = plt.subplots(2, 1)
np.random.seed(12345)

x = np.random.normal(100, 20, 200) + np.random.normal(40, 5, 200)
x = np.log2(x)

print(shapiro(x))
# (0.9857848882675171, 0.04184681549668312)     ### 非正态
stats.probplot(x, plot=axs[0])

x2, _ = boxcox(x)
print(shapiro(x2))
# (0.9948143362998962, 0.7225888967514038)      ### 正态
stats.probplot(x2, plot=axs[1])
plt.show()
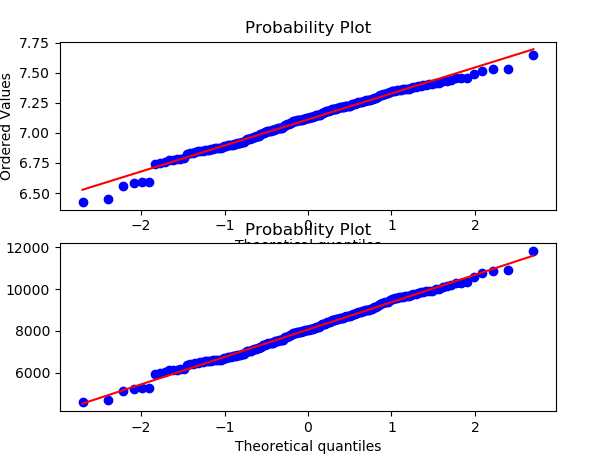
输出:上图为 非正态,下图为 经 boxcox 转换后的 正态数据

参考资料:
https://blog.csdn.net/QimaoRyan/article/details/72861387
https://www.jianshu.com/p/a264b8a245d2 ks检验
https://www.cnblogs.com/arkenstone/p/5496761.html ks检验
https://docs.scipy.org/doc/scipy/reference/generated/scipy.stats.anderson.html#scipy.stats.anderson scipy.stats.anderson
https://docs.scipy.org/doc/scipy-0.7.x/reference/generated/scipy.stats.kstest.html scipy.stats.kstest
以上是关于SciPy - 正态性 与 KS 检验的主要内容,如果未能解决你的问题,请参考以下文章