R与时间序列分析
Posted hqczsh
tags:
篇首语:本文由小常识网(cha138.com)小编为大家整理,主要介绍了R与时间序列分析相关的知识,希望对你有一定的参考价值。
一、案例来源与某书籍,数据集样式,采用动态线性回归的方式拟合时间序列模型:
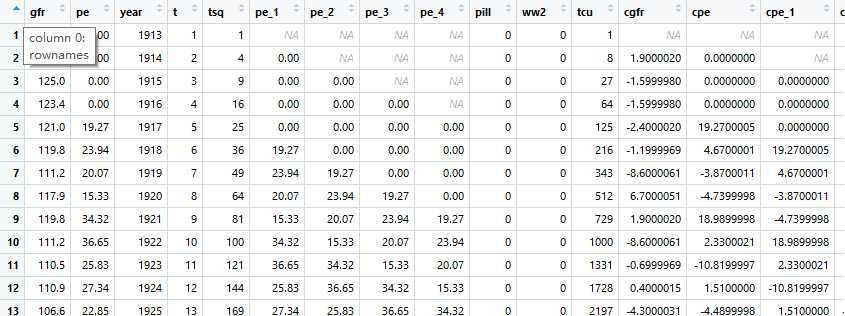
查找gfr与自变量pe、ww2、pill的关系,R代码如下:
rm(list = ls())
setwd("D:download系数金融时间序列分析")

library(foreign);library(dynlm);library(car);library(lmtest)
fertil3 <- read.dta("http://fmwww.bc.edu/ec-p/data/wooldridge/fertil3.dta")

tsdata <- ts(fertil3,start = 1913) # create time series start at 1913

# 建立动态回归(dynlm函数),包含滞后项(maybe x or y,this is x: L()),此时包含1阶和2阶滞后
res <- dynlm(gfr~pe+L(pe) + L(pe,2) + ww2 + pill, data = tsdata) # create Linear regression of model with lags
coeftest(res)

# F test  H0 : all pe coefficients are=0
linearHypothesis(res, matchCoefs(res,"pe"))
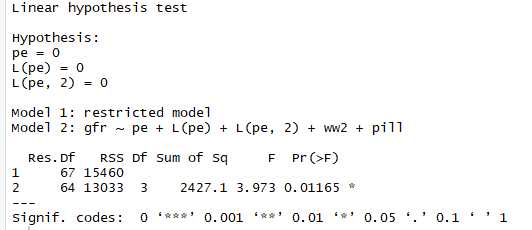
pe取2阶滞后,pe coefficients are=0,对因变量的影响pe相关性均不强,再进行F检验得到如下效果。
二、去趋势(针对非平稳性时间序列数据,如存在伪回归问题)
解决方式:
- 自变量中加人趋势项(trend函数),将数据集从时间维度上做一个趋势,减轻趋势性对回归的影响
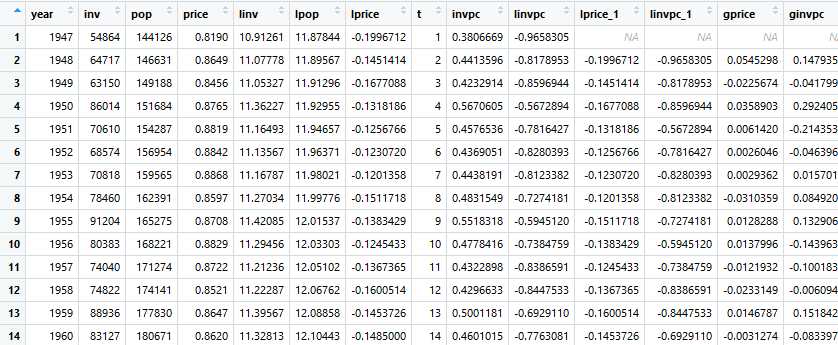
数据集:
library(foreign);library(dynlm); library(stargazer)
hseinv <- read.dta("http://fmwww.bc.edu/ec-p/data/wooldridge/hseinv.dta")

tsdata <- ts(hseinv, start = 1947)

res1 <- dynlm(log(invpc) ~ log(price), data =  tsdata)
res2 <- dynlm(log(invpc) ~ log(price) + trend(tsdata), data = tsdata)

stargazer(res1,res2,type = "text")
检验结果如下:
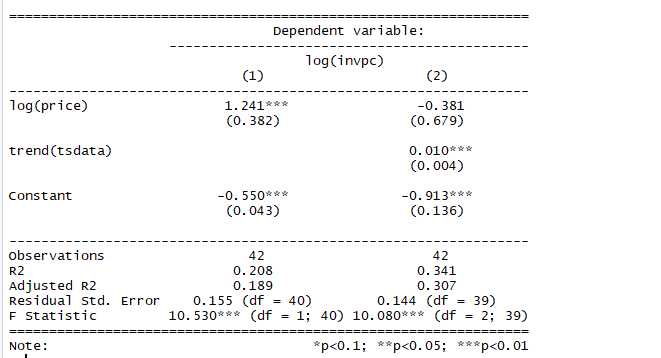
结果看出趋势项对回归的影响是显著的,有趋势项时,自变量不显著,不含趋势项时,自变量是显著的。说明存在伪回归问题,存在趋势项同时影响X和Y,但X和Y之间不存在相关性。
三、去季节性影响(season())
library(foreign); library(dynlm); library(lmtest)
barium <- read.dta("http://fmwww.bc.edu/ec-p/data/wooldridge/barium.dta")

tsdata <- ts(barium, start= c(1978,2), frequency = 12) # 月度数据,monthly time series begining in Feb. 1978

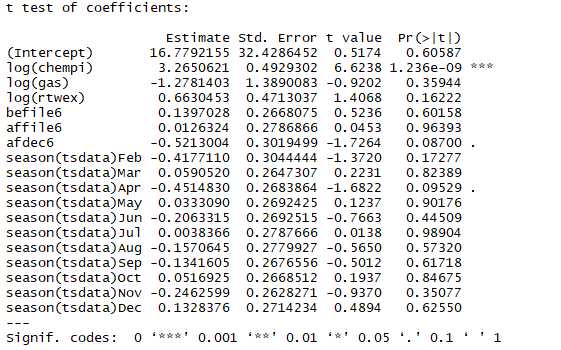
res <- dynlm(log(chnimp) ~ log(chempi) +log(gas) + log(rtwex) + befile6 + affile6 + afdec6 + season(tsdata), data = tsdata)

coeftest(res)
季度数据进行平均(哪些季度影响显著):
四、非平稳性序列--随机游走(游走结果不确定) X
1.形式(其中误差项服从独立同分布,xt-1前系数等于1):

随机游走模型(d=1,p=q=0),ARIMA(p,d,q)为ARIMA(0,1,0)即为随机游走模型。
set.seed(1234)
plot(c(0,50),c(0,0),type = ‘l‘, lwd=2, ylim = c(-18,18)) # initial graph

# loop over draws
for (r in 1:5) {
  e <- rnorm(50)
  y <- ts(cumsum(e))  # random walk as cumulative sum of shocks
  lines(y, col = gray(.6))  # add line to graph
}
图形形式如下: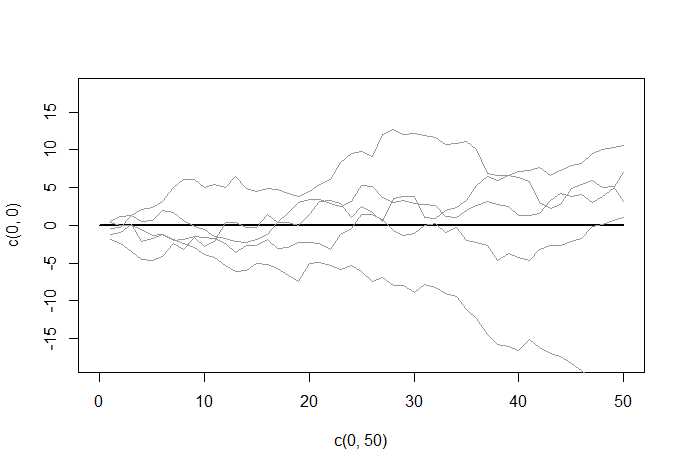
2. 带趋势的随机游走(在随机游走的基础上带上趋势a,如a=2):
set.seed(2224)
plot(c(0,50),c(0,100),type = ‘l‘, lwd=2) # initial graph

# loop over draws
for (r in 1:5) {
  e <- rnorm(50)
  y <- ts(cumsum(2+e))  # random walk as cumulative sum of shocks
  lines(y, col = gray(.6))  # add line to graph
}
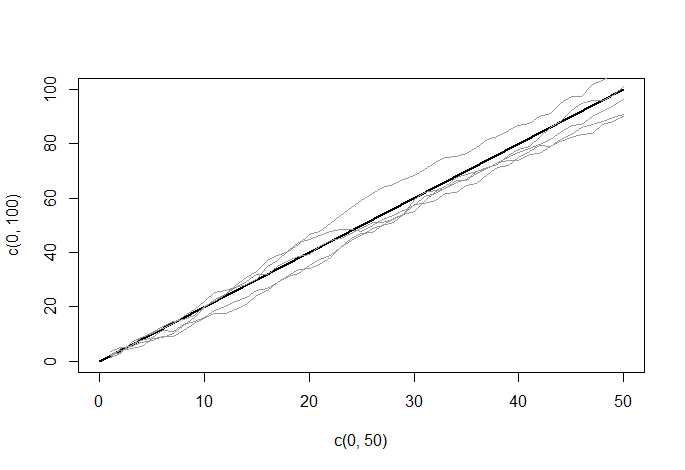
随机游走非平稳序列需Xt前系数=1,相反平稳序列需系数小于1
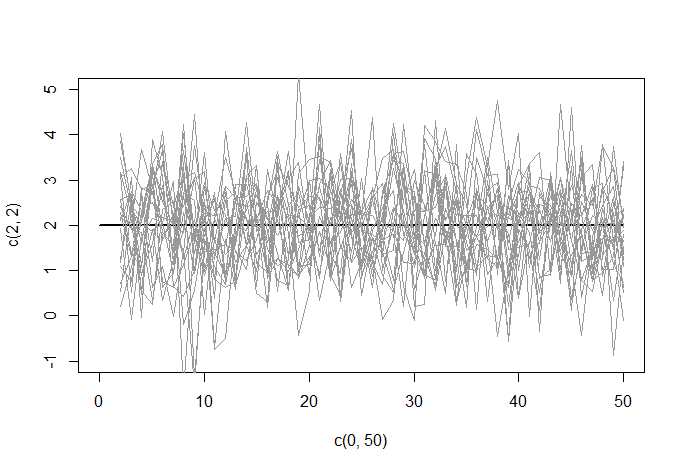
3.差分方式处理随机游走(yt-yt-1,yt-1-yt-2,...................),作用是使时间序列中单位根或随机游走变平稳
set.seed(22224)
plot(c(0,50),c(2,2),type = ‘l‘, lwd=2,ylim = c(-1,5)) # initial graph

# loop over draws
for (r in 1:20) {
  e <- rnorm(50)
  y <- ts(cumsum(2+e))  # random walk as cumulative sum of shocks
  Dy <- diff(y)      # first difference
  lines(Dy, col = grey(.6))  # add line to graph
}
以上是关于R与时间序列分析的主要内容,如果未能解决你的问题,请参考以下文章