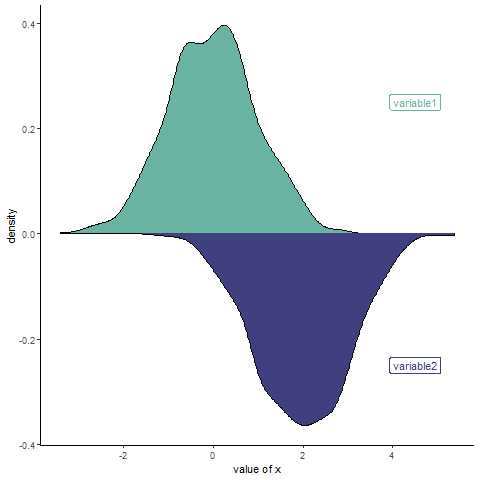
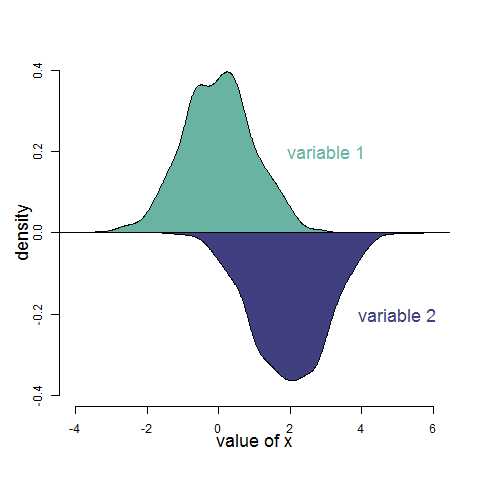
R仿图:Base plot仿geom_density()
Posted enjoy-respect-9527
tags:
篇首语:本文由小常识网(cha138.com)小编为大家整理,主要介绍了R仿图:Base plot仿geom_density()相关的知识,希望对你有一定的参考价值。
先放geom_density()图层的仿照网址:https://www.r-graph-gallery.com/density_mirror_ggplot2.html
- 生成数据
data <- data.frame(
  var1 = rnorm(1000),
  var2 = rnorm(1000, mean=2)
)
- ggpolot2
ggplot(data, aes(x=x) ) +
  geom_density( aes(x = var1, y = ..density..), fill="#69b3a2" ) +
  geom_label( aes(x=4.5, y=0.25, label="variable1"), color="#69b3a2") +
  geom_density( aes(x = var2, y = -..density..), fill= "#404080") +
  geom_label( aes(x=4.5, y=-0.25, label="variable2"), color="#404080") +
  xlab("value of x")+
  theme_classic()

- Base plot
a<-density(data$var1)
b<-density(data$var2)
plot.new()
plot.window(xlim=c(min(a$x,b$x),max(a$x,b$x)),
                 ylim=c(min(-a$y,-b$y),max(a$y,b$y)))
polygon(x=a$x,y=a$y,col="#69b3a2")
text(x=3,y=0.2,labels="variable 1",col="#69b3a2",cex=1.5)
polygon(x=b$x,y=-b$y,col= "#404080")
text(x=5,y=-0.2,labels="variable 2",col="#404080",cex=1.5)
abline(h=0)
axis(1)
axis(2)
mtext(text="value of x",side=1,adj=0.5,line=2,cex=1.5)
mtext(text="density",side=2,adj=0.5,line=2,cex=1.5)

以上是关于R仿图:Base plot仿geom_density()的主要内容,如果未能解决你的问题,请参考以下文章
R仿图:base plot画平行坐标图,仿《ggplot2:数据分析与图形艺术》
R仿图:base plot画平行坐标图,仿《ggplot2:数据分析与图形艺术》
R语言使用hexSticker包将R原生使用plot函数可视化的结果转换为六角图(六角贴六角形贴纸base plot to hex sticker)
R语言使用R原生函数plot和lines可视化线图并使用lty参数自定义线条类型lwd自定义设置线条的粗细col参数自定义线条颜色(Change R base plot line types)
R语言ggplot2可视化分面图(faceting)在所有的分面中添加相同的参考基准曲线(overlay a base or reference plot to all facets )