蛙蛙推荐: TensorFlow Hello World 之平面拟合
Posted onlytiancai
tags:
篇首语:本文由小常识网(cha138.com)小编为大家整理,主要介绍了蛙蛙推荐: TensorFlow Hello World 之平面拟合相关的知识,希望对你有一定的参考价值。
tensorflow 已经发布了 2.0 alpha 版本,所以是时候学一波 tf 了。官方教程有个平面拟合的类似Hello World的例子,但没什么解释,新手理解起来比较困难。
所以本文对这个案例进行详细解释,对关键的numpy, tf, matplotlib 函数加了注释,并且对原始数据和训练效果进行了可视化展示,希望对你理解这个案例有所帮助。
因为 2.0 成熟还需要一段时间,所以本文使用的是 tf 1.13.1 版本,Python 代码也从 Python 2 迁移到了 Python 3。
原始代码见如下链接:
http://www.tensorfly.cn/tfdoc/get_started/introduction.html
原始代码如下:
import tensorflow as tf
import numpy as np

# 使用 NumPy 生成假数据(phony data), 总共 100 个点.
x_data = np.float32(np.random.rand(2, 100)) # 随机输入
y_data = np.dot([0.100, 0.200], x_data) + 0.300

# 构造一个线性模型
#
b = tf.Variable(tf.zeros([1]))
W = tf.Variable(tf.random_uniform([1, 2], -1.0, 1.0))
y = tf.matmul(W, x_data) + b

# 最小化方差
loss = tf.reduce_mean(tf.square(y - y_data))
optimizer = tf.train.GradientDescentOptimizer(0.5)
train = optimizer.minimize(loss)

# 初始化变量
init = tf.initialize_all_variables()

# 启动图 (graph)
sess = tf.Session()
sess.run(init)

# 拟合平面
for step in xrange(0, 201):
    sess.run(train)
    if step % 20 == 0:
        print step, sess.run(W), sess.run(b)

# 得到最佳拟合结果 W: [[0.100  0.200]], b: [0.300]
使用 NumPy 生成假数据(phony data), 总共 100 个点.
x_data 是二维数组,每个维度各 100 个点,定义了一个平面
import tensorflow as tf
import numpy as np

x_data = np.float32(np.random.rand(2, 100)) # 随机输入
x_data[0][:10]
array([0.35073978, 0.16348423, 0.7059651 , 0.7696817 , 0.4036316 ,
0.52306384, 0.8748454 , 0.52280265, 0.9512267 , 0.10213694],
dtype=float32)x_data[1][:10]array([0.33513898, 0.07861521, 0.58426493, 0.87010854, 0.24188931,
0.64622885, 0.39593607, 0.4805421 , 0.6906034 , 0.41190282],
dtype=float32)y_data 由 x_data 经过变换得到,np.dot 实现矩阵乘法,要求第一个矩阵的列数和第二个矩阵的行数相同,最后加一个偏移量
比如 y_data[0] 就等于 x_data[0][0]*0.1 + x_data[1][0]*0.2 +0.3
这里整体的效果,相当于对原始的平面在三维空间进行了一个倾斜旋转,倾斜的参数由一个权重 W=[0.1, 0.2] 和偏移量 b=0.3 来确定
y_data = np.dot([0.100, 0.200], x_data) + 0.300
y_data[:10]
array([0.40210177, 0.33207147, 0.4874495 , 0.55098988, 0.38874102,
0.48155215, 0.46667175, 0.44838868, 0.53324335, 0.39259426])原始数据可视化
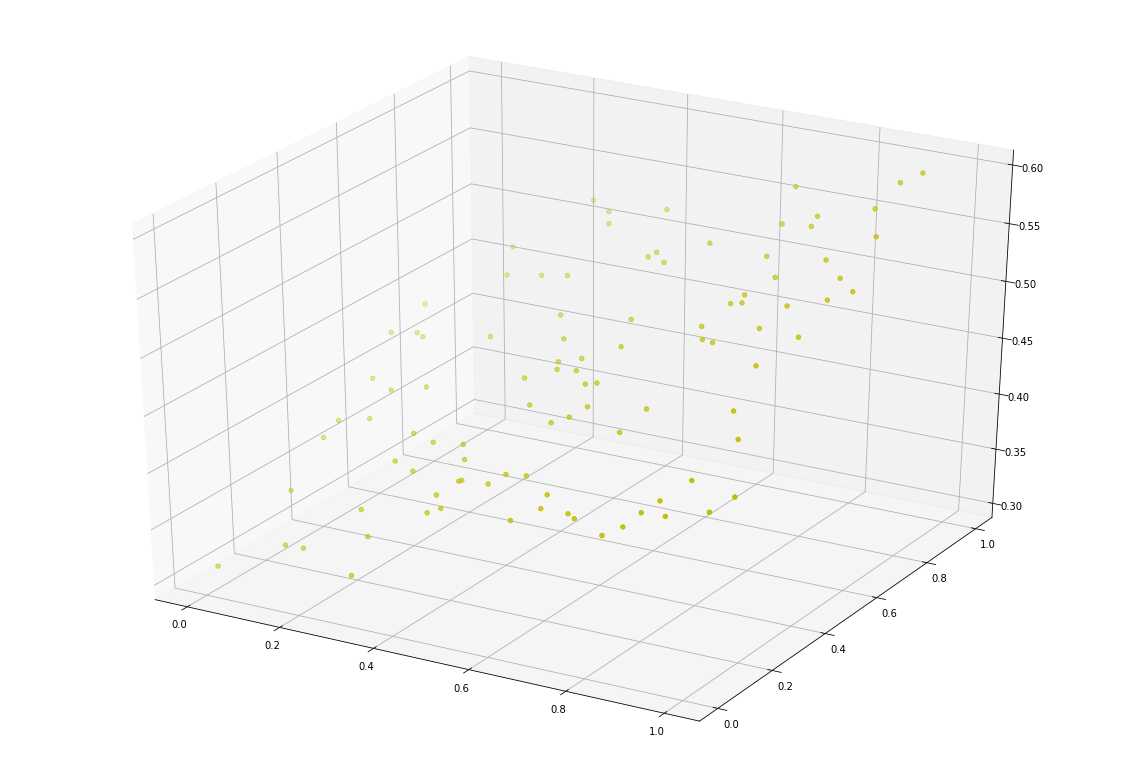
使用 matplotlib 的 scatter 功能实现 3D 散点图,x 轴是 x_data[0], y 轴是 x_data[1],z 轴是 y_data
import matplotlib.pyplot as plt
from mpl_toolkits.mplot3d import Axes3D

x, y, z = x_data[0], x_data[1], y_data
fig = plt.figure(figsize=(20, 14))
ax = fig.add_subplot(111, projection='3d')
ax.scatter(x, y, z, c='y')
plt.show()
构造一个线性模型
线性模型一般由权重 W 和偏移量 b 来描述,平面上直线拟合 W 是一个标量数字,而本例在三维空间进行平面拟合,所以 W 是一个有两个分量的向量。
b = tf.Variable(tf.zeros([1]))
b
<tf.Variable 'Variable:0' shape=(1,) dtype=float32_ref>W = tf.Variable(tf.random_uniform([1, 2], -1.0, 1.0))
W<tf.Variable 'Variable_1:0' shape=(1, 2) dtype=float32_ref>y 是模拟的结果,tf.matmul 将矩阵 A 乘以矩阵 B,生成 A * B,最后加上偏移量 b
y = tf.matmul(W, x_data) + b
y
<tf.Tensor 'add:0' shape=(1, 100) dtype=float32>最小化方差
定义损失函数,线性回归里常用的是均方误差,就是真实值和预测值的差的平方和
loss = tf.reduce_mean(tf.square(y - y_data))定义优化器,这里使用梯度下降算法
optimizer = tf.train.GradientDescentOptimizer(0.5)使用指定的优化器和损失函数定义一个训练
train = optimizer.minimize(loss)初始化变量
init = tf.global_variables_initializer()启动图 (graph)
sess = tf.Session()
sess.run(init)
拟合平面
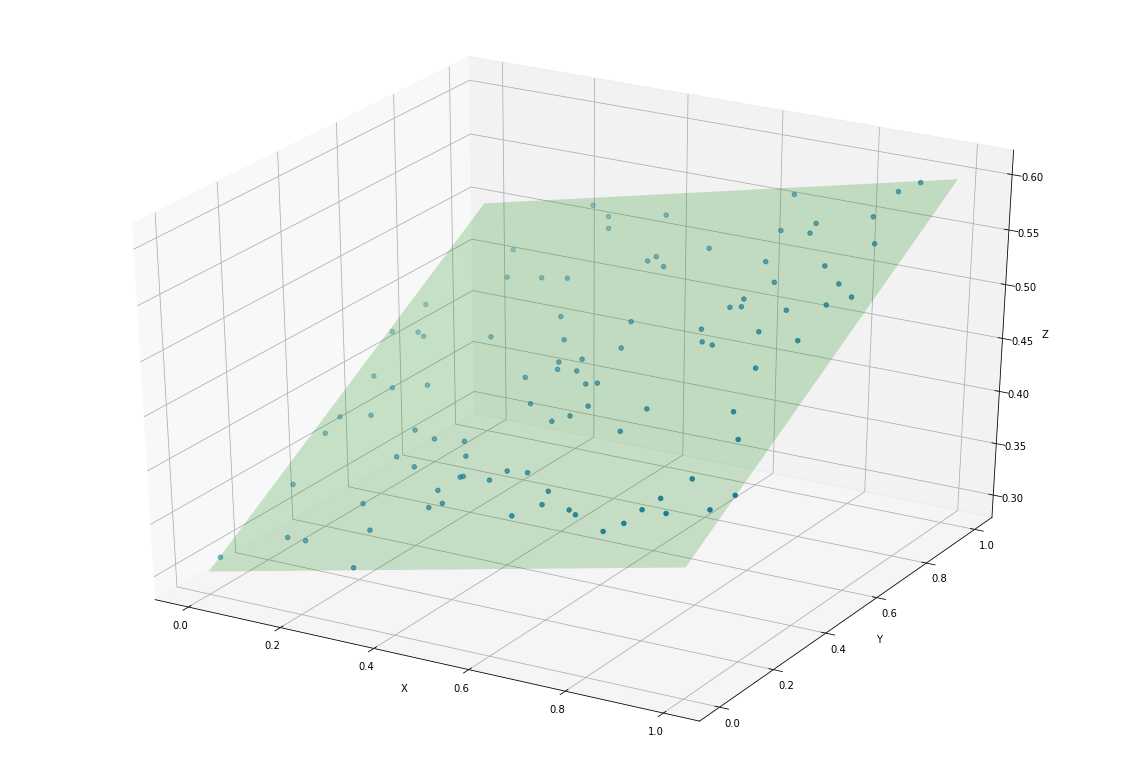
我们知道真实的 W 为 [0.1, 0.2],b 为 0.3,看下迭代训练 200 次的拟合效果怎么样
for step in range(0, 201):
    sess.run(train)
    if step % 20 == 0:
        print(step, sess.run(W), sess.run(b))
0 [[ 0.8425213 -0.12354811]] [0.13099673]
20 [[0.289453 0.12614608]] [0.2357107]
40 [[0.15044135 0.18556874]] [0.28013656]
60 [[0.11361164 0.19769716]] [0.29380444]
80 [[0.10372839 0.1998468 ]] [0.29805225]
100 [[0.10103785 0.20009856]] [0.2993837]
120 [[0.1002938 0.20006898]] [0.29980397]
140 [[0.1000846 0.20003161]] [0.2999374]
160 [[0.10002476 0.20001256]] [0.29997995]
180 [[0.10000735 0.20000464]] [0.29999357]
200 [[0.10000221 0.20000164]] [0.29999793]这里迭代 200 次的结果 W 为 [0.10000221 0.20000164], b 为 0.29999793,可以看出跟真实值差别非常小了
拟合效果可视化
把原始的分布在三维空间的点,组成一个个的三元组,分别表示 x, y, z 的坐标值
import numpy as np
from mpl_toolkits.mplot3d import Axes3D
import matplotlib.pyplot as plt

points = list(zip(x_data[0],x_data[1],y_data))
points[:10]
[(0.35073978, 0.33513898, 0.40210177302360534),
(0.16348423, 0.07861521, 0.33207146525382997),
(0.7059651, 0.58426493, 0.4874494969844818),
(0.7696817, 0.87010854, 0.5509898781776428),
(0.4036316, 0.24188931, 0.3887410223484039),
(0.52306384, 0.64622885, 0.4815521538257599),
(0.8748454, 0.39593607, 0.4666717529296875),
(0.52280265, 0.4805421, 0.44838868379592894),
(0.9512267, 0.6906034, 0.5332433462142945),
(0.10213694, 0.41190282, 0.3925942569971085)]w_val = sess.run(W)
b_val = sess.run(b)def cross(a, b):
return [a[1]*b[2] - a[2]*b[1],
a[2]*b[0] - a[0]*b[2],
a[0]*b[1] - a[1]*b[0]]
# https://stackoverflow.com/questions/20699821/find-and-draw-regression-plane-to-a-set-of-points
def show(points, a, b, c):
# 定义画布
fig = plt.figure(figsize=(20, 14))
ax = fig.add_subplot(111, projection='3d')
# 绘制原始的散点
xs, ys, zs = zip(*points)
ax.scatter(xs, ys, zs)
# 绘制拟合平面
point = np.array([0.0, 0.0, c])
normal = np.array(cross([1,0,a], [0,1,b]))
d = -point.dot(normal)
xx, yy = np.meshgrid([0,1], [0,1])
z = (-normal[0] * xx - normal[1] * yy - d) * 1. / normal[2]
ax.plot_surface(xx, yy, z, alpha=0.2, color=[0,1,0])
ax.set_xlabel('X')
ax.set_ylabel('Y')
ax.set_zlabel('Z')
plt.show()
show(points, w_val[0][0],w_val[0][1],b_val[0])
以上是关于蛙蛙推荐: TensorFlow Hello World 之平面拟合的主要内容,如果未能解决你的问题,请参考以下文章