matplotlib----初探------4条形图
Posted dushuhubian
tags:
篇首语:本文由小常识网(cha138.com)小编为大家整理,主要介绍了matplotlib----初探------4条形图相关的知识,希望对你有一定的参考价值。
概念
>>>>>>>>>>>>>>>>>>>>>>>>>>>>>>>>>>>>>>>>>>>>>>>>>>>>>>>>>>>>>>>>>>>>>>>>>>>>>>>>>>>>>>>>>>>
以长方形的长度为变量的统计图表
用来比较多个项目分类的数据大小
通常利用于较小的数据集分析
例如不同季度的销量,不同国家的人口等
>>>>>>>>>>>>>>>>>>>>>>>>>>>>>>>>>>>>>>>>>>>>>>>>>>>>>>>>>>>>>>>>>>>>>>>>>>>>>>>>>>>>>>>>>>>
简单的例子
参数调整 - height, width, bottom, color, orientation
并列条形图 VS 层叠条形图
import numpy as np
import matplotlib.pyplot as plt
N=5
y=[20,10,30,25,15]
index = np.arange(N)
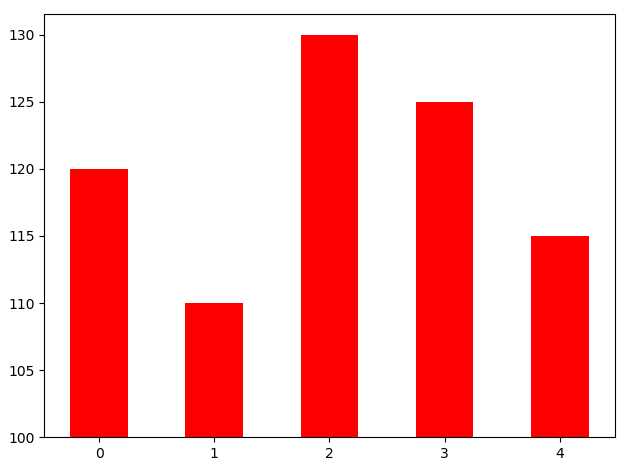
p1 = plt.bar(index, height=y,width=0.5,bottom=100,color=‘red‘)
plt.show()

》》》》》》》》》》》》》》》》》》》》》》》》》》》》》》》》》》》》》》》》》》》》》》》》》》》
import numpy as np
import matplotlib.pyplot as plt
N=5
y=[20,10,30,25,15]
index = np.arange(N)
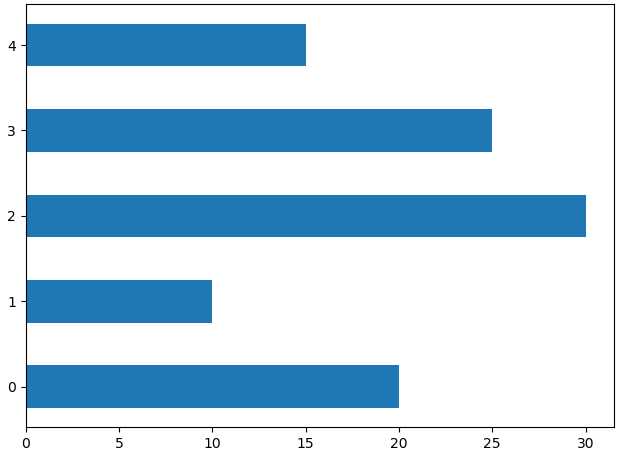
p2 = plt.bar(0, bottom=index, width=y,height=0.5,orientation=‘horizontal‘)
plt.show()

》》》》》》》》》》》》》》》》》》》》》》》》》》》》》》》》》》》》》》》》》》》》》》》》》》》》》》》》》》
两栏:
import numpy as np
import matplotlib.pyplot as plt
N=5
y=[20,10,30,25,15]
index = np.arange(N)
index=np.arange(4)
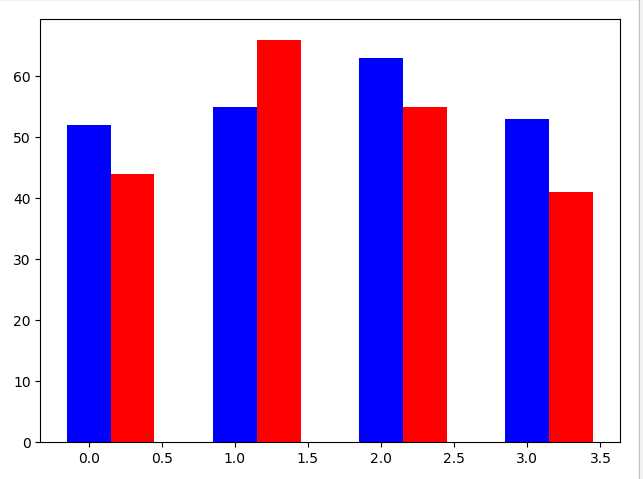
sales_BJ=[52,55,63,53]
sales_SH=[44,66,55,41]
bar_width=0.3
plt.bar(index,sales_BJ,bar_width,color=‘b‘)
plt.bar(index+bar_width,sales_SH,bar_width,color=‘r‘)
plt.show()

>>>>>>>>>>>>>>>>>>>>>>>>>>>>>>>>>>>>>>>>>>>>>>>>>>>>>>>>>>>>>>>>>>>>>>
import numpy as np
import matplotlib.pyplot as plt
N=5
y=[20,10,30,25,15]
index = np.arange(N)
index=np.arange(4)
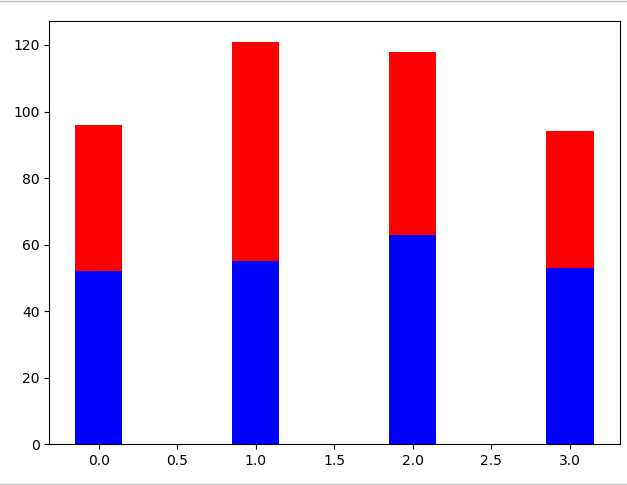
sales_BJ=[52,55,63,53]
sales_SH=[44,66,55,41]
bar_width=0.3
plt.bar(index,sales_BJ,bar_width,color=‘b‘)
plt.bar(index,sales_SH,bar_width,color=‘r‘,bottom=sales_BJ)
plt.show()

以上是关于matplotlib----初探------4条形图的主要内容,如果未能解决你的问题,请参考以下文章
如何在垂直条形图matplotlib中的y轴和第一个条之间放置间隙
Matplotlib 保存为 pdf 在条形图中未显示影线标记 - 潜在错误?