pyqtgraph绘图案例-动态的正余弦波形图
Posted xjt2018
tags:
篇首语:本文由小常识网(cha138.com)小编为大家整理,主要介绍了pyqtgraph绘图案例-动态的正余弦波形图相关的知识,希望对你有一定的参考价值。
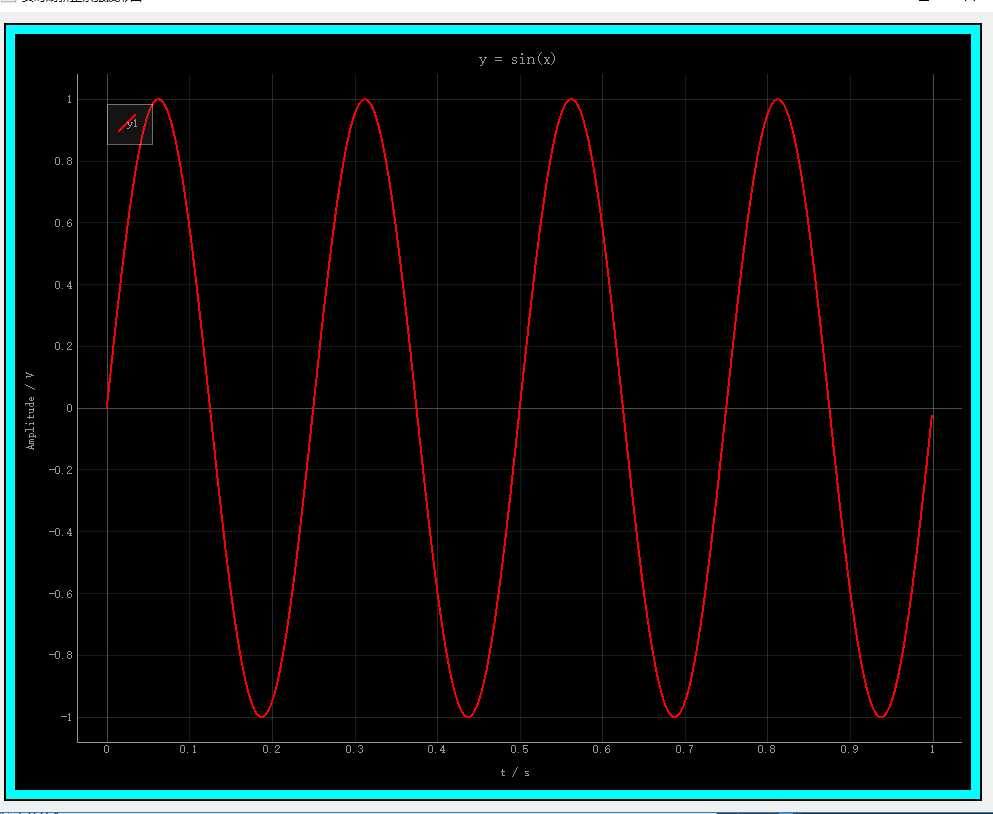
先看一个简单的小例子:

完整代码:
import numpy as np
import pyqtgraph as pg
import sys
from PyQt5.QtWidgets import QWidget,QApplication,QFrame,QGridLayout,QVBoxLayout

class Example(QWidget):

    def __init__(self):
        super(Example, self).__init__()
        self.initUI()
        self.generate_image()

    def initUI(self):
        self.setGeometry(200,200,1000,800)
        self.setWindowTitle("实时刷新正余弦波形图")
        self.gridLayout = QGridLayout(self)
        self.frame = QFrame(self)
        self.frame.setFrameShape(QFrame.Panel)
        self.frame.setFrameShadow(QFrame.Plain)
        self.frame.setLineWidth(2)
        self.frame.setStyleSheet("background-color:rgb(0,255,255);")
        self.gridLayout.addWidget(self.frame,0,0,1,2)
        self.setLayout(self.gridLayout)

    def generate_image(self):
        verticalLayout = QVBoxLayout(self.frame)
        win = pg.GraphicsLayoutWidget(self.frame)
        verticalLayout.addWidget(win)
        p = win.addPlot(title="动态波形图")
        p.showGrid(x=True,y=True)
        p.setLabel(axis="left",text="Amplitude / V")
        p.setLabel(axis="bottom",text="t / s")
        p.setTitle("y = sin(x)")
        p.addLegend()
        # mkpen(‘y‘, width=3, style=QtCore.Qt.DashLine)
        self.curve1 = p.plot(pen=pg.mkPen("r",width=2),name="y1")  #设置pen 格式
        self.Fs = 1024.0 #采样频率
        self.N = 1024    #采样点数
        self.f0 = 4.0    #信号频率
        self.pha = 0     #初始相位
        self.t = np.arange(self.N) / self.Fs    #时间向量 1*1024的矩阵
        self.curve1.setData(self.t, np.sin(8 * np.pi * self.t + self.pha * np.pi / 180.0))

if __name__ == ‘__main__‘:
    app = QApplication(sys.argv)
    ex = Example()
    ex.show()
    sys.exit(app.exec_())
实时刷新正余弦波形的例子
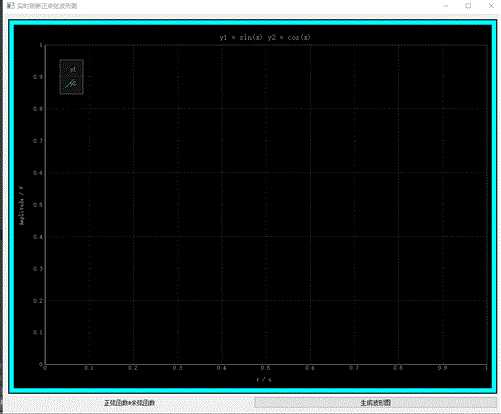
下面举一个复杂一点的例子,这个例子在一个波形图上实时连续刷新两条曲线,分别为正弦曲线和余弦曲线,运行结果的动态图如下:
效果如下:

完整代码:
import numpy as np
import pyqtgraph as pg
import sys
from PyQt5.QtWidgets import QWidget,QApplication,QFrame,QGridLayout,QLabel,QPushButton,QVBoxLayout
from PyQt5.QtCore import Qt,QTimer

class Example(QWidget):

    def __init__(self):
        super(Example, self).__init__()
        self.initUI()
        self.generate_image()

    def initUI(self):
        self.setGeometry(200,200,1000,800)
        self.setWindowTitle("实时刷新正余弦波形图")
        self.gridLayout = QGridLayout(self)
        self.frame = QFrame(self)
        self.frame.setFrameShape(QFrame.Panel)
        self.frame.setFrameShadow(QFrame.Plain)
        self.frame.setLineWidth(2)
        self.frame.setStyleSheet("background-color:rgb(0,255,255);")
        self.label = QLabel(self)
        self.label.setText("正弦函数&余弦函数")
        self.label.setAlignment(Qt.AlignCenter)
        self.button = QPushButton(self)
        self.button.setText("生成波形图")
        self.button.clicked.connect(self.btnClick)
        self.gridLayout.addWidget(self.frame,0,0,1,2)
        self.gridLayout.addWidget(self.label,1,0,1,1)
        self.gridLayout.addWidget(self.button,1,1,1,1)

        self.setLayout(self.gridLayout)

    def generate_image(self):
        verticalLayout = QVBoxLayout(self.frame)
        win = pg.GraphicsLayoutWidget(self.frame)
        verticalLayout.addWidget(win)
        p = win.addPlot(title="动态波形图")
        p.showGrid(x=True,y=True)
        p.setLabel(axis="left",text="Amplitude / V")
        p.setLabel(axis="bottom",text="t / s")
        p.setTitle("y1 = sin(x)  y2 = cos(x)")
        p.addLegend()

        self.curve1 = p.plot(pen="r",name="y1")
        self.curve2 = p.plot(pen="g",name="y2")

        self.Fs = 1024.0 #采样频率
        self.N = 1024    #采样点数
        self.f0 = 4.0    #信号频率
        self.pha = 0     #初始相位
        self.t = np.arange(self.N) / self.Fs    #时间向量 1*1024的矩阵

    def plotData(self):
        self.pha += 10
        self.curve1.setData(self.t , np.sin(8 * np.pi  * self.t+ self.pha * np.pi/180.0))
        self.curve2.setData(self.t , np.cos(8 * np.pi  * self.t + self.pha * np.pi/180.0))

    def btnClick(self):
        self.button.setText("再次点击加速!")
        timer = QTimer(self)
        timer.timeout.connect(self.plotData)
        timer.start(100)


if __name__ == ‘__main__‘:
    app = QApplication(sys.argv)
    ex = Example()
    ex.show()
    sys.exit(app.exec_())
以上是关于pyqtgraph绘图案例-动态的正余弦波形图的主要内容,如果未能解决你的问题,请参考以下文章