Zabbix 监控 TCP 连接 。
Posted
tags:
篇首语:本文由小常识网(cha138.com)小编为大家整理,主要介绍了Zabbix 监控 TCP 连接 。相关的知识,希望对你有一定的参考价值。
一步:编写监控 shell 脚本。
[[email protected] ~]# cd /usr/local/zabbix/scripts/
[[email protected] scripts]# vim tcp_status.sh
#!/bin/bash
############################################################
#$Name: tcp_status.sh
#$Version: v1.0
$Function: TCP Status
$Author: wangwang
$organization: wangwang
#$Create Date: 2018-12-25
#$Description: Monitor TCP Service Status
############################################################
[ $# -ne 1 ] && echo "Usage:CLOSE-WAIT|CLOSED|CLOSING|ESTAB|FIN-WAIT-1|FIN-WAIT-2|LAST-ACK|LISTEN|SYN-RECV SYN-SENT|TIME-WAIT" && exit 1
tcp_status_fun(){
TCP_STAT=$1
ss -ant | awk ‘NR>1 {++s[$1]} END {for(k in s) print k,s[k]}‘ > /tmp/ss.txt
TCP_STAT_VALUE=$(grep "$TCP_STAT" /tmp/ss.txt | cut -d ‘ ‘ -f2)
if [ -z "$TCP_STAT_VALUE" ];then
TCP_STAT_VALUE=0
fi
echo $TCP_STAT_VALUE
}
tcp_status_fun $1;
二步:添加执行权限 。
[[email protected] scripts]# chmod +x tcp_status.sh
三步:编辑 zabbix_agentd.conf 的配置文件。
[[email protected] ~]# vim /etc/zabbix/zabbix_agentd.conf
UserParameter=tcp_status[*],/bin/bash /etc/zabbix/scripts/tcp_status.sh "$1"
四步:重启 zabbix-agent 修改配置文件必须重启。
[[email protected] ~]# systemctl restart zabbix-agent
五步:Server测试Agent是否能获取到值,通过Zabbix_get(不要直接执行脚本)。
[[email protected] ~]# zabbix_get -s 192.168.90.11 -k tcp_status[ESTAB]
10
六步:添加所有监控项(将模板关联主机)。
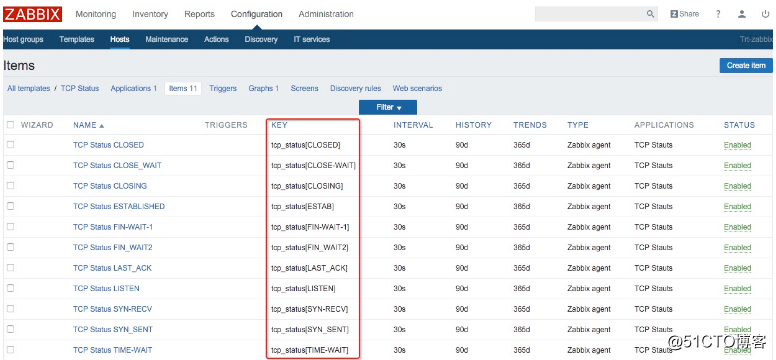
七步:查看相关数据。
以上是关于Zabbix 监控 TCP 连接 。的主要内容,如果未能解决你的问题,请参考以下文章