转百度地图Canvas实现十万CAD数据秒级加载
Posted feixiablog
tags:
篇首语:本文由小常识网(cha138.com)小编为大家整理,主要介绍了 转百度地图Canvas实现十万CAD数据秒级加载相关的知识,希望对你有一定的参考价值。
Github上看到:
https://github.com/lcosmos/map-canvas
这个实现台风轨迹,这个数据量非常庞大,当时打开时,看到这么多数据加载很快,感到有点震惊,然后自己研究了一番,发现作者采用的是Canvas作为百度的自定义覆盖层。
<!DOCTYPE html>
<html>
<head>
    <title>百度地图Canvas海量折线</title>
    <meta http-equiv="Content-Type" content="text/html; charset=utf-8" />
    <meta name="viewport" content="width=device-width, initial-scale=1.0, maximum-scale=1.0, minimum-scale=1.0, user-scalable=no">
    <link rel="stylesheet" href="css/style.css">
    <script type="text/javascript" src="https://api.map.baidu.com/api?v=2.0&ak=nuWah68S1WieW2AEwiT8T3Ro&s=1"></script>
    <script type="text/javascript" src="https://cdn.bootcss.com/jquery/2.1.0/jquery.js"></script>
</head>
<body>
    <div id="map" style="width:100%;height:500px;"></div>
    <script type="text/javascript" src="XXXX/extra/pointLine.js"></script>
    <script type="text/javascript">
		var styleJson=[{
			"featureType": "highway",
			"elementType": "geometry.stroke",
			"stylers": {
				"color": "#ff0000"
			}
		}];
        var map = new BMap.Map(‘map‘, {
            minZoom: 5
        });
        map.centerAndZoom(new BMap.Point(112.954699, 27.851256), 13);
        map.enableScrollWheelZoom(true);
        map.setMapStyle({
            styleJson: styleJson
        });
        $.getJSON(‘XXXX/extra/line.json‘, function (result) {
            var pointLine = new PointLine(map, {
                //线条宽度
                lineWidth: 2,
                //线条颜色
                lineStyle: ‘#F9815C‘,
                //数据源
                data: result,
                //事件
                methods: {
                    click: function (e, name) {
                        console.log(‘你当前点击的是‘ + name);
                    },
                    mousemove: function (e, name) {
                        console.log(‘你当前点击的是‘ + name);
                    }
                }
            });
        })
    </script>
</body>
</html>
数据源渲染pointLine.js
(function (global, factory) {
    typeof exports === ‘object‘ && typeof module !== ‘undefined‘ ? module.exports = factory() :
    typeof define === ‘function‘ && define.amd ? define(factory) :
    (global.PointLine = factory());
}(this, (function () {

‘use strict‘;

function CanvasLayer(options) {
    this.options = options || {};
    this.paneName = this.options.paneName || ‘labelPane‘;
    this.zIndex = this.options.zIndex || 0;
    this._map = options.map;
    this._lastDrawTime = null;
    this.show();
}

CanvasLayer.prototype = new BMap.Overlay();

CanvasLayer.prototype.initialize = function (map) {
    this._map = map;
    var canvas = this.canvas = document.createElement(‘canvas‘);
    var ctx = this.ctx = this.canvas.getContext(‘2d‘);
    canvas.style.cssText = ‘position:absolute;‘ + ‘left:0;‘ + ‘top:0;‘ + ‘z-index:‘ + this.zIndex + ‘;‘;
    this.adjustSize();
    this.adjustRatio(ctx);
    map.getPanes()[this.paneName].appendChild(canvas);
    var that = this;
    map.addEventListener(‘resize‘, function () {
        that.adjustSize();
        that._draw();
    });
    return this.canvas;
};

CanvasLayer.prototype.adjustSize = function () {
    var size = this._map.getSize();
    var canvas = this.canvas;
    canvas.width = size.width;
    canvas.height = size.height;
    canvas.style.width = canvas.width + ‘px‘;
    canvas.style.height = canvas.height + ‘px‘;
};

CanvasLayer.prototype.adjustRatio = function (ctx) {
    var backingStore = ctx.backingStorePixelRatio || ctx.webkitBackingStorePixelRatio || ctx.mozBackingStorePixelRatio || ctx.msBackingStorePixelRatio || ctx.oBackingStorePixelRatio || ctx.backingStorePixelRatio || 1;
    var pixelRatio = (window.devicePixelRatio || 1) / backingStore;
    var canvasWidth = ctx.canvas.width;
    var canvasHeight = ctx.canvas.height;
    ctx.canvas.width = canvasWidth * pixelRatio;
    ctx.canvas.height = canvasHeight * pixelRatio;
    ctx.canvas.style.width = canvasWidth + ‘px‘;
    ctx.canvas.style.height = canvasHeight + ‘px‘;
    // console.log(ctx.canvas.height, canvasHeight);
    ctx.scale(pixelRatio, pixelRatio);
};

CanvasLayer.prototype.draw = function () {
    var self = this;
    var args = arguments;

    clearTimeout(self.timeoutID);
    self.timeoutID = setTimeout(function () {
        self._draw();
    }, 15);
};

CanvasLayer.prototype._draw = function () {
    var map = this._map;
    var size = map.getSize();
    var center = map.getCenter();
    if (center) {
        var pixel = map.pointToOverlayPixel(center);
        this.canvas.style.left = pixel.x - size.width / 2 + ‘px‘;
        this.canvas.style.top = pixel.y - size.height / 2 + ‘px‘;
        this.dispatchEvent(‘draw‘);
        this.options.update && this.options.update.call(this);
    }
};

CanvasLayer.prototype.getContainer = function () {
    return this.canvas;
};

CanvasLayer.prototype.show = function () {
    if (!this.canvas) {
        this._map.addOverlay(this);
    }
    this.canvas.style.display = ‘block‘;
};

CanvasLayer.prototype.hide = function () {
    this.canvas.style.display = ‘none‘;
    //this._map.removeOverlay(this);
};

CanvasLayer.prototype.setZIndex = function (zIndex) {
    this.canvas.style.zIndex = zIndex;
};

CanvasLayer.prototype.getZIndex = function () {
    return this.zIndex;
};

var tool = {
    merge: function merge(settings, defaults) {
        Object.keys(settings).forEach(function (key) {
            defaults[key] = settings[key];
        });
    },
    //计算两点间距离
    getDistance: function getDistance(p1, p2) {
        return Math.sqrt((p1[0] - p2[0]) * (p1[0] - p2[0]) + (p1[1] - p2[1]) * (p1[1] - p2[1]));
    },
    //判断点是否在线段上
    containStroke: function containStroke(x0, y0, x1, y1, lineWidth, x, y) {
        if (lineWidth === 0) {
            return false;
        }
        var _l = lineWidth;
        var _a = 0;
        var _b = x0;
        // Quick reject
        if (y > y0 + _l && y > y1 + _l || y < y0 - _l && y < y1 - _l || x > x0 + _l && x > x1 + _l || x < x0 - _l && x < x1 - _l) {
            return false;
        }

        if (x0 !== x1) {
            _a = (y0 - y1) / (x0 - x1);
            _b = (x0 * y1 - x1 * y0) / (x0 - x1);
        } else {
            return Math.abs(x - x0) <= _l / 2;
        }
        var tmp = _a * x - y + _b;
        var _s = tmp * tmp / (_a * _a + 1);
        return _s <= _l / 2 * _l / 2;
    }
};

var PointLine = function PointLine(map, userOptions) {
    var self = this;

    self.map = map;
    self.lines = [];
    self.pixelList = [];

    //默认参数
    var options = {
        //线条宽度
        lineWidth: 1,
        //线条颜色
        lineStyle: ‘#F9815C‘
    };

    //全局变量
    var baseLayer = null,
        width = map.getSize().width,
        height = map.getSize().height;

    function Line(opts) {
        this.name = opts.name;
        this.path = opts.path;
    }

    Line.prototype.getPointList = function () {
        var points = [],
            path = this.path;
        if (path && path.length > 0) {
            path.forEach(function (p) {
                points.push({
                    name: p.name,
                    pixel: map.pointToPixel(p.location)
                });
            });
        }
        return points;
    };

    Line.prototype.draw = function (context) {
        var pointList = this.pixelList || this.getPointList();
        context.save();
        context.beginPath();
        context.lineWidth = options.lineWidth;
        context.strokeStyle = options.lineStyle;
        context.moveTo(pointList[0].pixel.x, pointList[0].pixel.y);
        for (var i = 0, len = pointList.length; i < len; i++) {
            context.lineTo(pointList[i].pixel.x, pointList[i].pixel.y);
        }
        context.stroke();
        context.closePath();
        context.restore();
    };

    //底层canvas渲染,标注,线条
    var brush = function brush() {
        var baseCtx = baseLayer.canvas.getContext(‘2d‘);
        if (!baseCtx) {
            return;
        }

        addLine();

        baseCtx.clearRect(0, 0, width, height);

        self.pixelList = [];
        self.lines.forEach(function (line) {
            self.pixelList.push({
                name: line.name,
                data: line.getPointList()
            });
            line.draw(baseCtx);
        });
    };

    var addLine = function addLine() {
        if (self.lines && self.lines.length > 0) return;
        var dataset = options.data;
        dataset.forEach(function (l, i) {
            var line = new Line({
                name: l.name,
                path: []
            });
            l.data.forEach(function (p, j) {
                line.path.push({
                    name: p.name,
                    location: new BMap.Point(p.Longitude, p.Latitude)
                });
            });
            self.lines.push(line);
        });
    };

    self.init(userOptions, options);

    baseLayer = new CanvasLayer({
        map: map,
        update: brush
    });

    this.clickEvent = this.clickEvent.bind(this);

    this.bindEvent();
};

PointLine.prototype.init = function (settings, defaults) {
    //合并参数
    tool.merge(settings, defaults);

    this.options = defaults;
};

PointLine.prototype.bindEvent = function (e) {
    var map = this.map;
    if (this.options.methods) {
        if (this.options.methods.click) {
            map.setDefaultCursor("default");
            map.addEventListener(‘click‘, this.clickEvent);
        }
        if (this.options.methods.mousemove) {
            map.setDefaultCursor("default");
            map.addEventListener(‘mousemove‘, this.clickEvent);
        }
    }
};

PointLine.prototype.clickEvent = function (e) {
    var self = this,
        lines = self.pixelList;
    if (lines.length > 0) {
        lines.forEach(function (line, i) {
            for (var j = 0; j < line.data.length; j++) {
                var beginPt = line.data[j].pixel;
                if (line.data[j + 1] == undefined) {
                    return;
                }
                var endPt = line.data[j + 1].pixel;
                var curPt = e.pixel;
                var isOnLine = tool.containStroke(beginPt.x, beginPt.y, endPt.x, endPt.y, self.options.lineWidth, curPt.x, curPt.y);
                if (isOnLine) {
                    self.options.methods.click(e, line.name);
                    return;
                }
            }
        });
    }
};

return PointLine;

})));
数据源:line.json
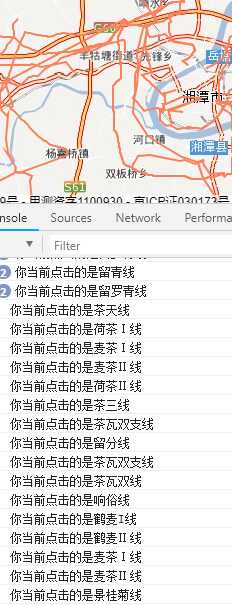
效果图片:

以上是关于 转百度地图Canvas实现十万CAD数据秒级加载的主要内容,如果未能解决你的问题,请参考以下文章