numpy统计分布显示
Posted moon2
tags:
篇首语:本文由小常识网(cha138.com)小编为大家整理,主要介绍了numpy统计分布显示相关的知识,希望对你有一定的参考价值。
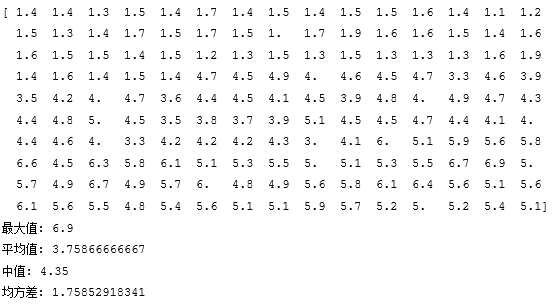
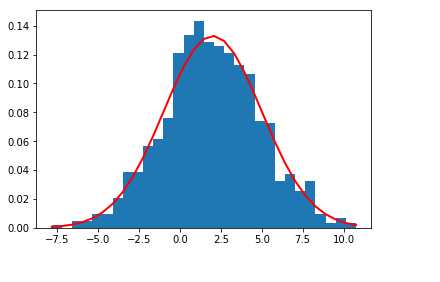
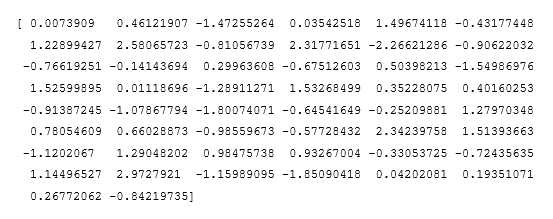
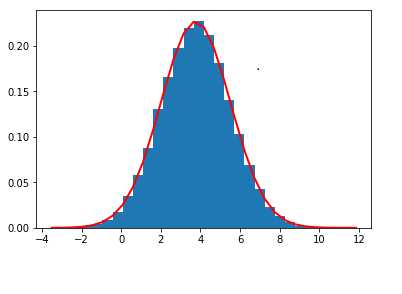
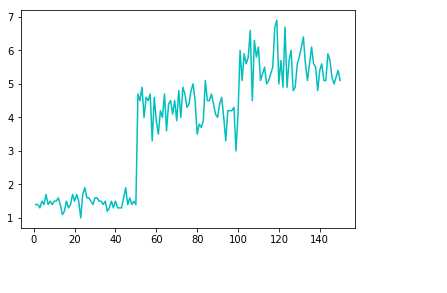
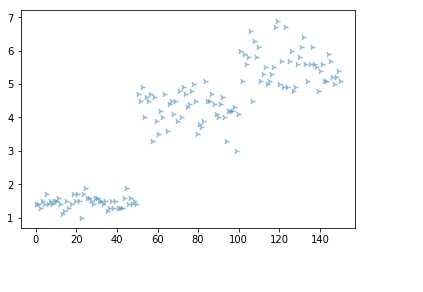
#导包
import numpy as np
#导入鸢尾花数据
from sklearn.datasets import load_iris
data = load_iris()
pental_len = data.data[:,2]
print(pental_len)

#计算尾花花瓣长度的最大值,平均值,中值,均方差
print("最大值:",np.max(pental_len))
print("平均值:",np.mean(pental_len))
print("中值:",np.median(pental_len))
print("均方差:",np.std(pental_len))

#用np.random.normal()产生一个正态分布的随机数组,并显示出来
#正态分布
import numpy as np
import matplotlib.pyplot as plt
mu = 2  #期望为2
sigma = 3  #标准差为3
num = 1000  #个数为10000
rand_data = np.random.normal(mu, sigma, num)
count, bins, ignored = plt.hist(rand_data, 30, normed=True)
plt.plot(bins, 1/(sigma * np.sqrt(2 * np.pi)) *np.exp( - (bins - mu)**2 / (2 * sigma**2)), linewidth=2, color=‘r‘)
plt.show()

#np.random.randn()产生一个正态分布的随机数组,并显示出来
Data=np.random.randn(50)
print(Data)

#显示鸢尾花花瓣长度的正态分布图,曲线图,散点图

#正态分布图
import numpy as np
import matplotlib.pyplot as plt
mu=np.mean(pental_len)
sigma=np.std(pental_len)
num=99999
rand_data = np.random.normal(mu,sigma,num)
count, bins, ignored = plt.hist(rand_data, 30, normed=True)
plt.plot(bins, 1/(sigma * np.sqrt(2 * np.pi)) *np.exp( - (bins - mu)**2 / (2 * sigma**2)), linewidth=2, color=‘r‘)
plt.show()
#曲线图#
plt.plot(np.linspace(1,150,num=150),pental_len,‘c‘)
plt.show()
#散点图#
plt.scatter(np.linspace(0,150,num=150),pental_len,alpha=0.5,marker=‘4‘)
plt.show()
以上是关于numpy统计分布显示的主要内容,如果未能解决你的问题,请参考以下文章