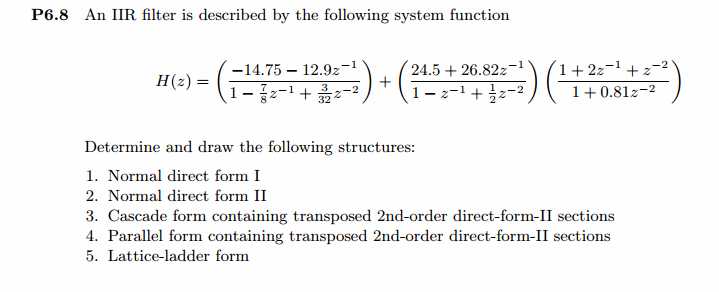
《DSP using MATLAB》Problem 6.8
Posted ky027wh-sx
tags:
篇首语:本文由小常识网(cha138.com)小编为大家整理,主要介绍了《DSP using MATLAB》Problem 6.8相关的知识,希望对你有一定的参考价值。
代码:
%% ++++++++++++++++++++++++++++++++++++++++++++++++++++++++++++++++++++++++++++++++
%%            Output Info about this m-file
fprintf(‘
***********************************************************
‘);
fprintf(‘        <DSP using MATLAB> Problem 6.8

‘);

banner();
%% ++++++++++++++++++++++++++++++++++++++++++++++++++++++++++++++++++++++++++++++++
b1 = [-14.75  -12.90];  nb1 = [0:1];
b2 = [ 24.5    26.82];  nb2 = [0:1];
b3 = [  1   2  1];      nb3 = [0:2];

a1 = [1  -7/8   3/32];  na1 = [0:2];
a2 = [1  -1     0.5];   na2 = [0:2];
a3 = [1   0     0.81];  na3 = [0:2];

a11 = conv(a2, a3); b11 = conv(b2, b3);


fprintf(‘
Direct form:
‘);
b = conv(b1, a11) + conv(a1, b11)
a = conv(a11, a1)


fprintf(‘
Convert DIRECT-form to PARALLEL-form :
‘);
[C, Bp, Ap] = dir2par(b, a)
C = 0;

fprintf(‘
Convert DIRECT-form to CASCADE-form :
‘);
[b0, Bc, Ac] = dir2cas(b, a)

fprintf(‘
Convert TF-form to SOS-form :
‘);
[sos, g] = tf2sos(b, a)

fprintf(‘
Convert DIRECT-form to LATTICE-LADDER-form :
‘);
[Klr, Clr] = dir2ladr(b, a)

fprintf(‘
Convert DIRECT-form to MATLAB LATTICE-LADDER-form :
‘);
[K, V] = tf2latc(b, a)

% -----------------------------------------
%     START check
% -----------------------------------------
n = [0:7];
delta = impseq(0, 0, 7)
%format long
format  short
hcas = casfiltr(b0, Bc, Ac, delta)

hpar = parfiltr(C, Bp, Ap, delta)

hladr = ladrfilt(Klr, Clr, delta)

hdir = filter(b, a, delta)
% -------------------------------------------
%       END check
% -------------------------------------------


figure(‘NumberTitle‘, ‘off‘, ‘Name‘, ‘P6.8 hcas(n), hpar(n)‘)
set(gcf,‘Color‘,‘white‘);
subplot(2,1,1); stem(n, hcas);
xlabel(‘n‘); ylabel(‘hcas(n)‘);
title(‘hcas(n)‘);  grid on;
subplot(2,1,2); stem(n, hpar);
xlabel(‘n‘); ylabel(‘hpar(n)‘);
title(‘hpar(n)‘);  grid on;

figure(‘NumberTitle‘, ‘off‘, ‘Name‘, ‘P6.8 hladr(n) hdir(n)‘)
set(gcf,‘Color‘,‘white‘);
subplot(2,1,1); stem(n, hladr);
xlabel(‘n‘); ylabel(‘hladr(n)‘);
title(‘hladr(n)‘);  grid on;
subplot(2,1,2); stem(n, hdir);
xlabel(‘n‘); ylabel(‘hdir(n)‘);
title(‘hdir(n)‘);  grid on;
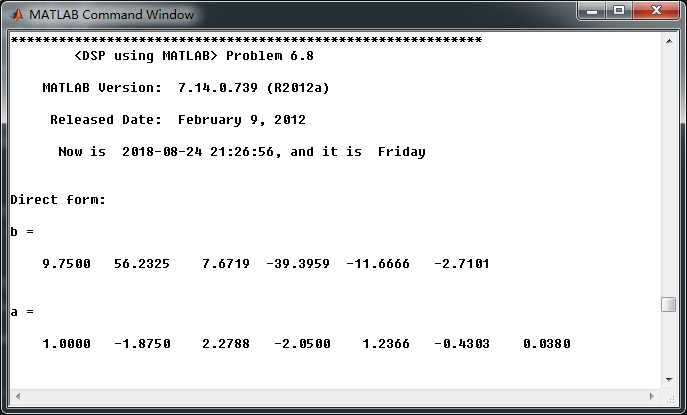
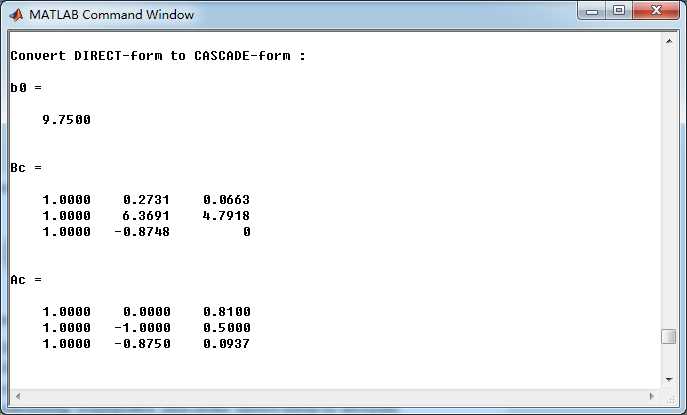
运行结果:
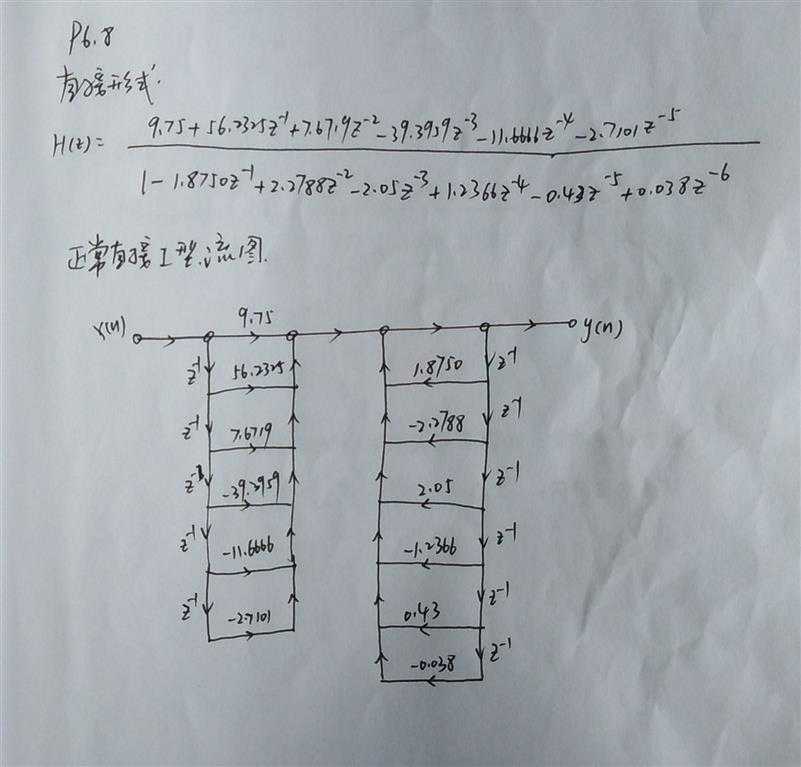
直接形式系数
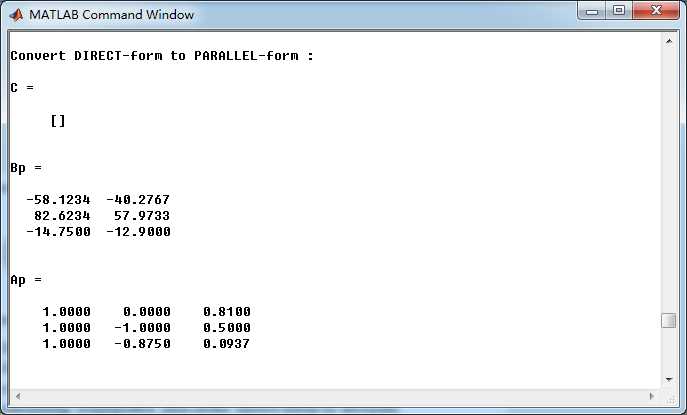
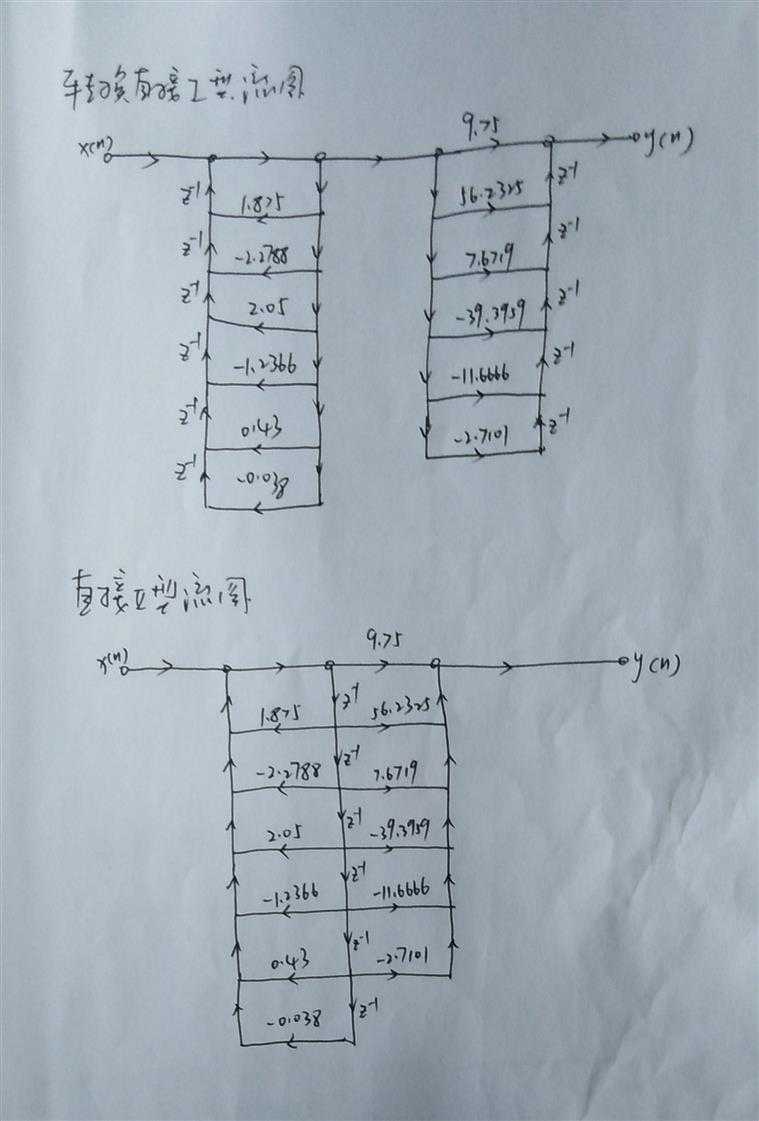
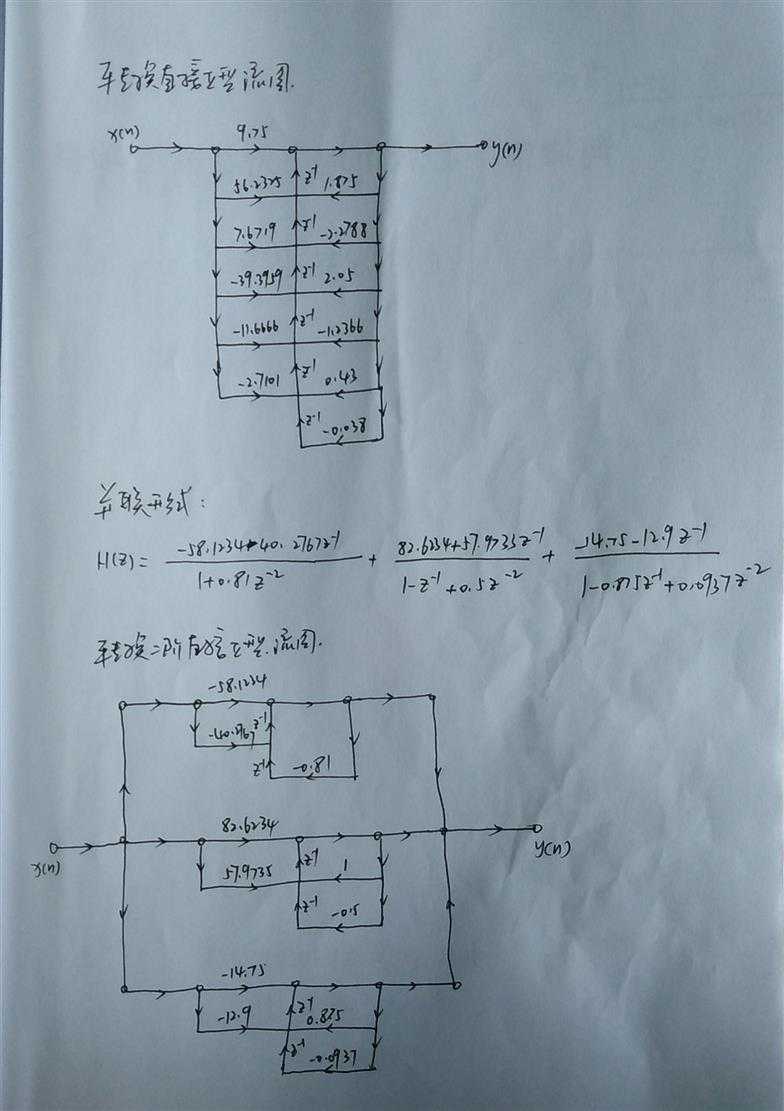
并联形式系数
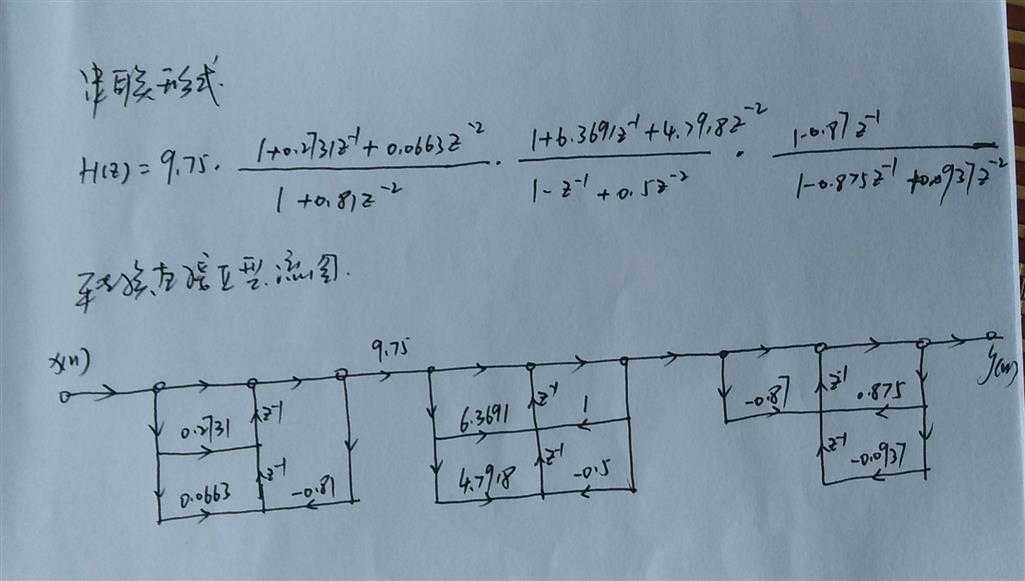
串联形式系数
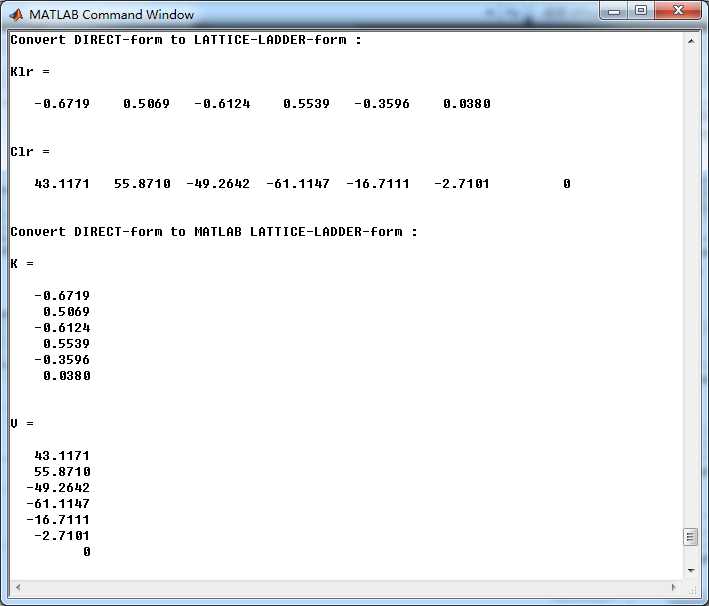
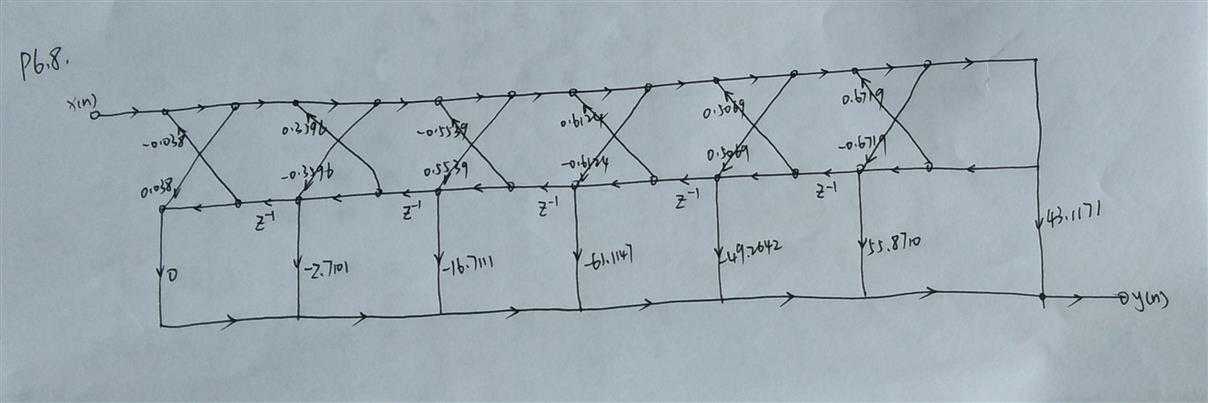
格型系数
以上是关于《DSP using MATLAB》Problem 6.8的主要内容,如果未能解决你的问题,请参考以下文章