Echarts自定义tootips
Posted lguow
tags:
篇首语:本文由小常识网(cha138.com)小编为大家整理,主要介绍了Echarts自定义tootips相关的知识,希望对你有一定的参考价值。
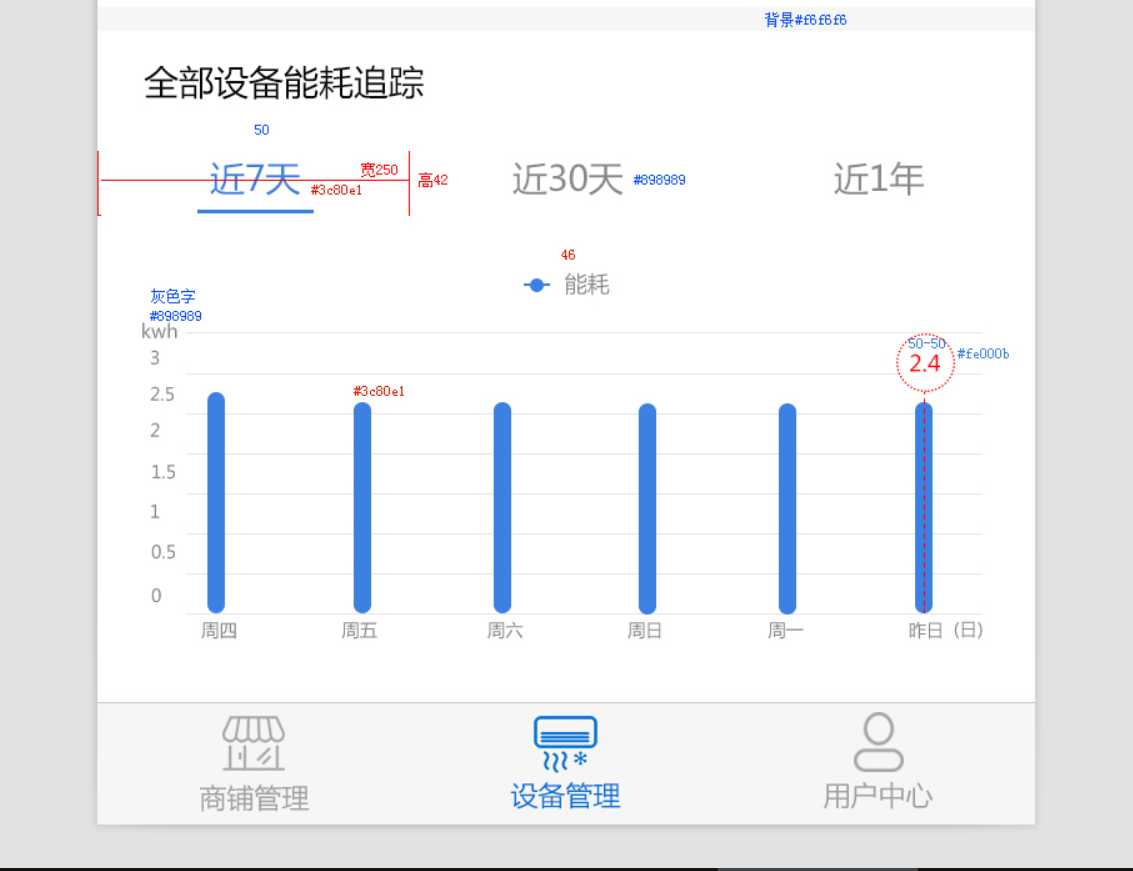
由于业务需求,现在要自定义tootips;
设计稿如下:

代码如下:
app.title = ‘坐标轴刻度与标签对齐‘;
var str1 = "top:-20px;border:0px solid #000;position:relative;width:100px;height:60px;line-height:60px;background:rgba(50,50,50,0.7);;border-radius:4px;text-align:center;";
var arrow="position:absolute;color:rgba(50,50,50,0.7);width: 0px;height:0px;height:0px;line-height: 0px;border-width: 10px 15px 0;border-style: solid dashed dashed dashed;border-left-color: transparent;border-right-color: transparent;bottom: -10px;right: 50%;margin-right:-15px";
option = {
    color: [‘#3398DB‘],
    tooltip : {
        trigger: ‘item‘,
        axisPointer : {            // 坐标轴指示器,坐标轴触发有效
            type : ‘shadow‘        // 默认为直线,可选为:‘line‘ | ‘shadow‘
        },
        position:"top",
        formatter:function(params)
        {

            return "<div style=‘"+str1+"‘><div style=‘"+arrow+"‘></div>"+params.value+"</div>";
        },
        backgroundColor:‘transparent‘
    },
    grid: {
        left: ‘3%‘,
        right: ‘4%‘,
        bottom: ‘3%‘,
        containLabel: true
    },
    xAxis : [
        {
            type : ‘category‘,
            data : [‘13:00‘, ‘13:05‘, ‘13:10‘, ‘13:15‘, ‘13:20‘, ‘13:25‘, ‘13:30‘,‘13:35‘,‘13:40‘,‘13:45‘,‘13:50‘,‘13:55‘],
            axisTick: {
                alignWithLabel: true
            }
        }
    ],
    yAxis : [
        {
            // type : ‘category‘,
            // data : [‘10‘,‘20‘,‘30‘,‘40‘],
            axisTick: {
                alignWithLabel: true
            }
        }
    ],
    series : [
        {
            name:‘直接访问‘,
            type:‘bar‘,
            barWidth: ‘40%‘,
            data:[1, 3, 2, 3, 4, 2, 1,3,3,2,3,2]
        },

    ],
    label: {
            normal: {
                show: true,
                position: ‘top‘,
                formatter: ‘{c}‘
            }
        },
    itemStyle: {
                normal: {

                    color: new echarts.graphic.LinearGradient(0, 0, 0, 1, [{
                        offset: 0,
                        color: ‘rgba(17, 168,171, 1)‘
                    }, {
                        offset: 1,
                        color: ‘rgba(17, 168,171, 0.1)‘
                    }]),
                    shadowColor: ‘rgba(0, 0, 0, 0.1)‘,
                    shadowBlur: 10
                }
            }
};
更多 :http://gallery.echartsjs.com/editor.html?c=xB1DgDmtmb
以上是关于Echarts自定义tootips的主要内容,如果未能解决你的问题,请参考以下文章
原生 js 实现类 3d 地图大屏展示自动高亮轮播显示悬浮提示 tootip 的方案:svg + popper.js 定位引擎