Matlab&Mathematica对三维空间上的点进行椭圆拟合
Posted tiandsp
tags:
篇首语:本文由小常识网(cha138.com)小编为大家整理,主要介绍了Matlab&Mathematica对三维空间上的点进行椭圆拟合相关的知识,希望对你有一定的参考价值。
问题是这样:比如有一个地心惯性系的轨道,然后从轨道上取了几个点,问能不能根据这几个点把轨道还原了?
当然,如果知道轨道这几个点的速度的情况下,根据轨道六根数也是能计算轨道的,不过真近点角是随时间变动的。
下面我会用数学的方法来解这个问题,基本思想是通过拟合空间上点的平面与椭球平面的交线将该轨道计算出来,算是一种思路吧。
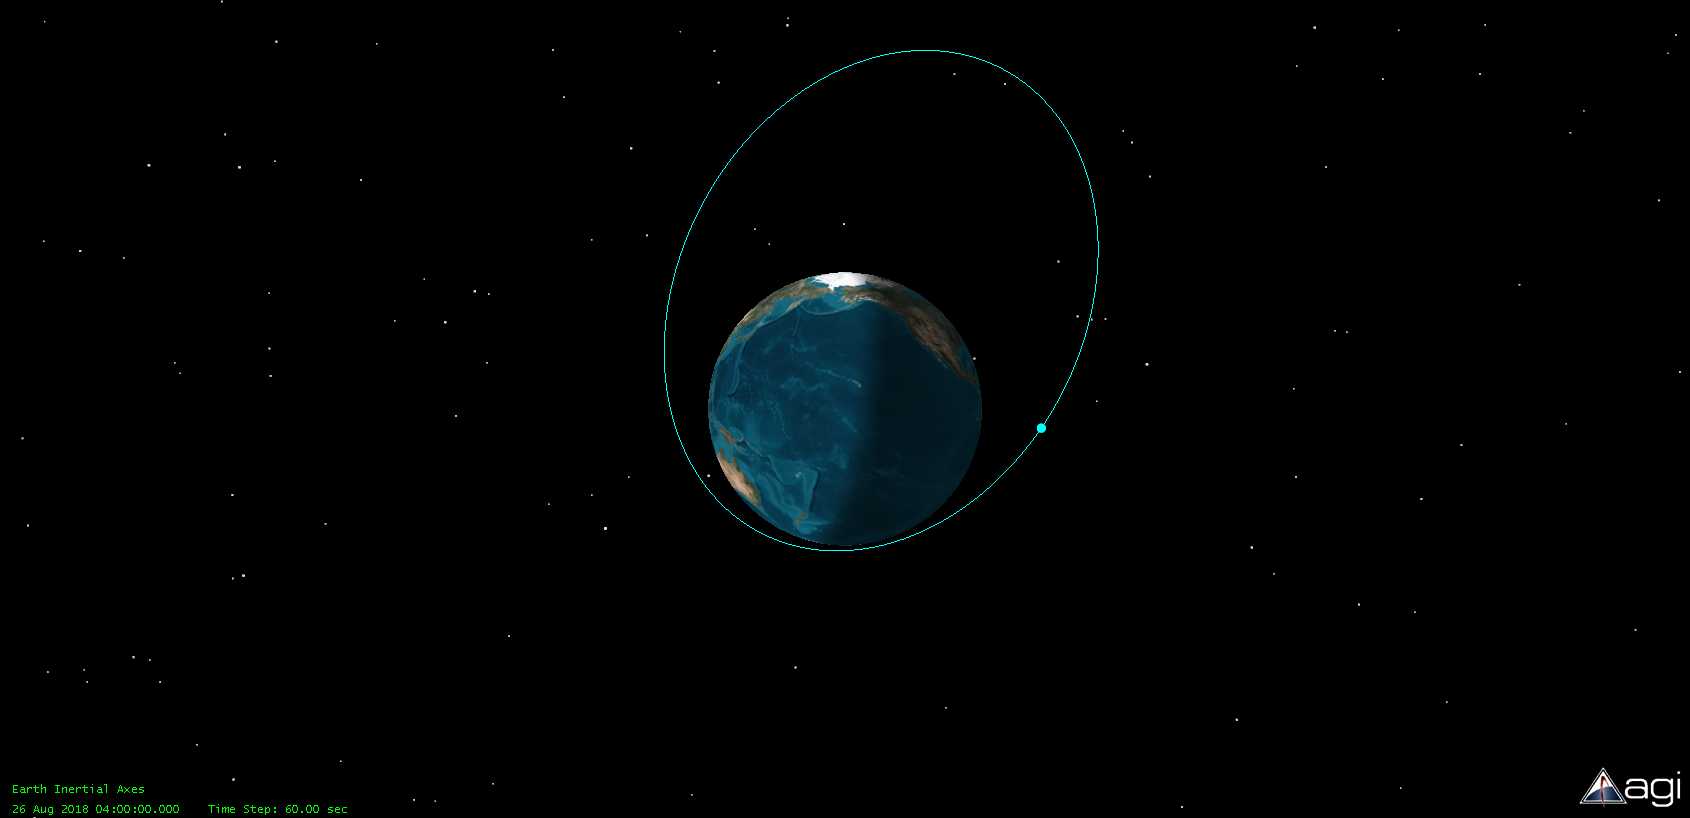
首先需要有轨道数据,我们就从STK上获得,我使用默认参数生成了一个轨道,如下图:
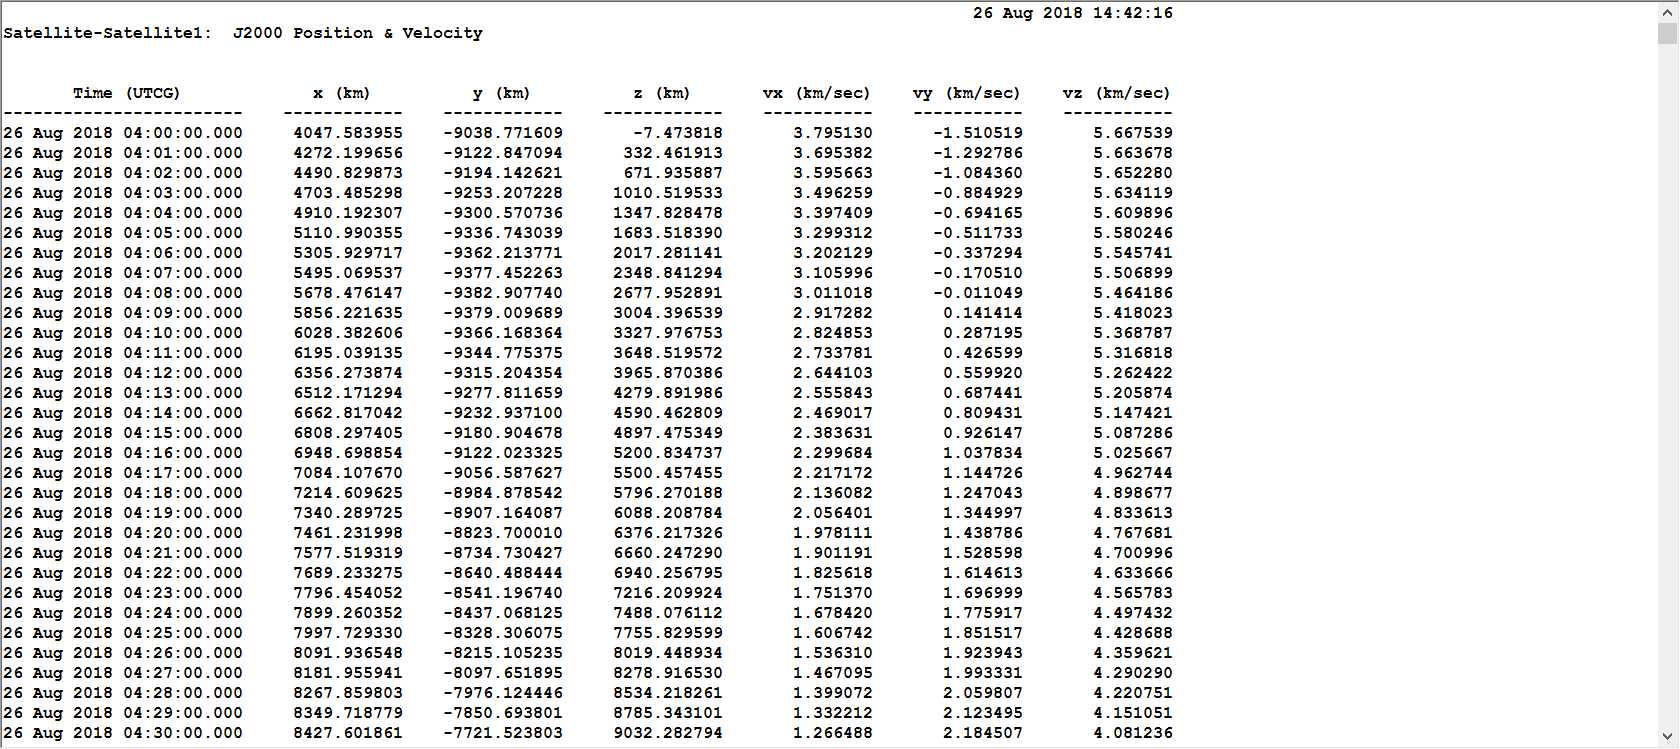
输出j2000下的位置速度:
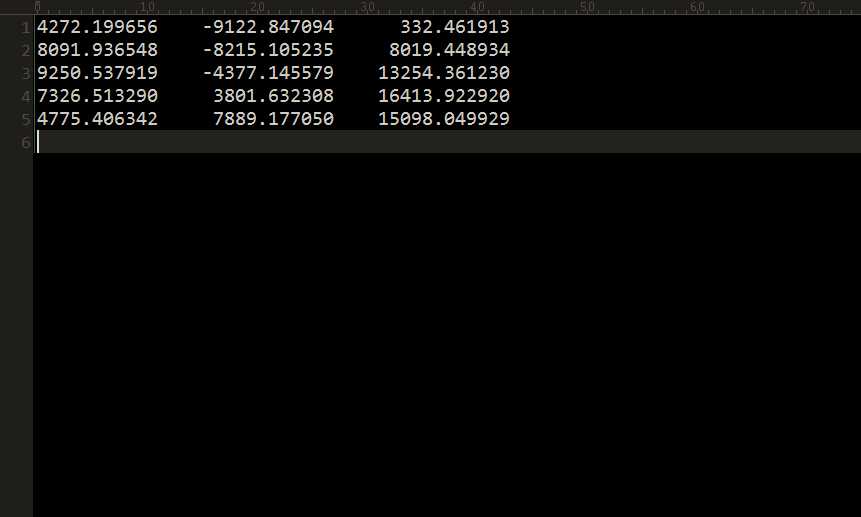
取其中5个点进行拟合:
可以先计算椭球,设椭球方程为x^2/a+y^2/b+z^2/c+d=0,然后求其最小二乘函数f(a,b,c,d) = sum((x^2/a+y^2/b+z^2/c+d)^2)。
通过单纯性法求该函数符合上面5个点的最小值时的a,b,c,d四个参数。
matlab里就是用fminsearch函数就行了。
代码如下:
clear all;
close all;
clc;

x=[4272.199656,8091.936548,9250.537919,7326.513290,4775.406342];
y=[-9122.847094,-8215.105235,-4377.145579,3801.632308,7889.177050];
z=[332.461913,8019.448934,13254.361230,16413.922920,15098.049929];

fun[email protected](t)sum((x.^2/t(1)+y.^2/t(2)+z.^2/t(3)+t(4)).^2);

[t fval]= fminsearch( fun , rand(4,1)) ; %单纯形法多元优化

t
这里的t就是要求的a,b,c,d四个参数。
我求的参数是
11831.9652077381
7748.53668377191
37674.4028071175
-14504.0838741735
得到椭球方程为:
x^2/11831.96520773810 + y^2/7748.536683771910 + z^2/37674.40280711745 - 14504.08387417353 = 0
Mathematica中画出来就是:
ContourPlot3D[
 x^2/11831.96520773810 + y^2/7748.536683771910 +
   z^2/37674.40280711745 - 14504.08387417353 == 0, {x, -20000,
  20000}, {y, -20000, 20000}, {z, -30000, 30000}]
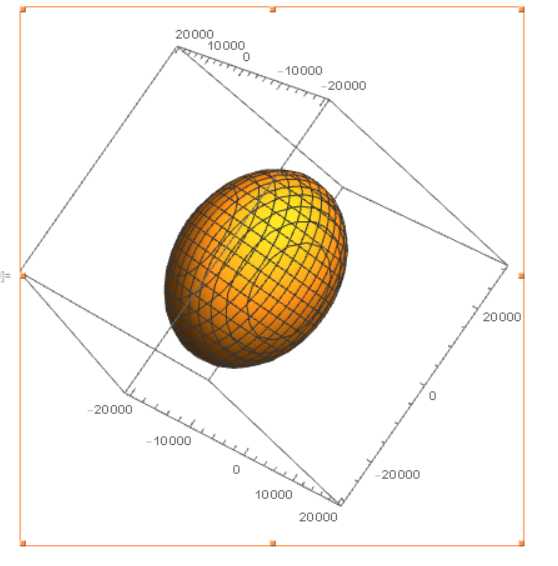
椭球有了,下面我们求平面,使用ransac进行平面拟合。
我参考了这篇博客:https://blog.csdn.net/u010128736/article/details/53422070
不过他好像也参考了我过去写的ransac直线拟合:https://www.cnblogs.com/tiandsp/archive/2013/06/03/3115743.html,有趣 : )
代码如下:
clc;clear all;close all;

iter = 1000;

x=[4272.199656,8091.936548,9250.537919,7326.513290,4775.406342];
y=[-9122.847094,-8215.105235,-4377.145579,3801.632308,7889.177050];
z=[332.461913,8019.448934,13254.361230,16413.922920,15098.049929];

data=[x;y;z];

%%% 绘制数据点
 figure;plot3(data(1,:),data(2,:),data(3,:),‘o‘);hold on; % 显示数据点
 number = size(data,2); % 总点数
 bestParameter1=0; bestParameter2=0; bestParameter3=0; % 最佳匹配的参数
 sigma = 1;
 pretotal=0;     %符合拟合模型的数据的个数

for i=1:iter
 %%% 随机选择三个点
     idx = randperm(number,3);
     sample = data(:,idx);

     %%%拟合直线方程 z=ax+by+c
     plane = zeros(1,3);
     x = sample(1, :);
     y = sample(2, :);
     z = sample(3, :);

     a = ((z(1)-z(2))*(y(1)-y(3)) - (z(1)-z(3))*(y(1)-y(2)))/((x(1)-x(2))*(y(1)-y(3)) - (x(1)-x(3))*(y(1)-y(2)));
     b = ((z(1) - z(3)) - a * (x(1) - x(3)))/(y(1)-y(3));
     c = z(1) - a * x(1) - b * y(1);
     plane = [a b -1 c]

     mask=abs(plane*[data; ones(1,size(data,2))]);    %求每个数据到拟合平面的距离
     total=sum(mask<sigma);              %计算数据距离平面小于一定阈值的数据的个数

     if total>pretotal            %找到符合拟合平面数据最多的拟合平面
         pretotal=total;
         bestplane=plane;          %找到最好的拟合平面
    end
 end
 %显示符合最佳拟合的数据
mask=abs(bestplane*[data; ones(1,size(data,2))])<sigma;
hold on;
k = 1;
for i=1:length(mask)
    if mask(i)
        inliers(1,k) = data(1,i);
        inliers(2,k) = data(2,i);
        plot3(data(1,i),data(2,i),data(3,i),‘r+‘);
        k = k+1;
    end
end

 %%% 绘制最佳匹配平面
 bestParameter1 = bestplane(1);
 bestParameter2 = bestplane(2);
 bestParameter3 = bestplane(4);
 xAxis = min(inliers(1,:)):max(inliers(1,:));
 yAxis = min(inliers(2,:)):max(inliers(2,:));
 [x,y] = meshgrid(-30000:1000:30000);
 z = bestParameter1 * x + bestParameter2 * y + bestParameter3;
 mesh(x, y, z);
 title([‘bestPlane:  z =  ‘,num2str(bestParameter1),‘x + ‘,num2str(bestParameter2),‘y + ‘,num2str(bestParameter3)]);
拟合结果如下:
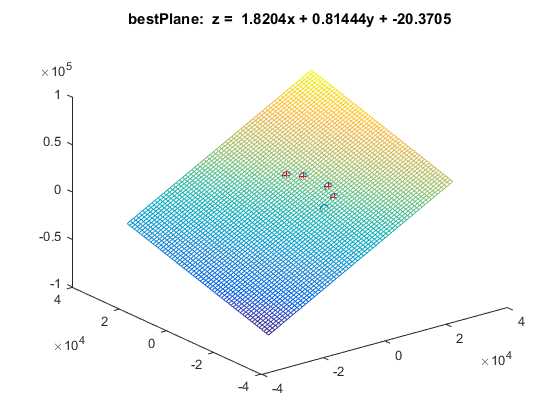
然后我们在Mathematica上画出平面与椭球:
代码如下:
data = {{4272.199656, -9122.847094,
    332.461913}, {8091.936548, -8215.105235,
    8019.448934}, {9250.537919, -4377.145579,
    13254.361230}, {7326.513290, 3801.632308, 16413.922920},
   {4775.406342, 7889.177050 , 15098.049929}};

P3 = ListPlot3D[data, ColorFunction -> Function[{x, y, z}, Hue[x]]]

P2 = ContourPlot3D[
  1.8204 x + 0.81444 y - z - 20.3705 == 0, {x, -30000,
   30000}, {y, -30000, 30000}, {z, -30000, 30000}]

P1 = ContourPlot3D[
  x^2/11831.96520773810 + y^2/7748.536683771910 +
    z^2/37674.40280711745 - 14504.08387417353 == 0, {x, -20000,
   20000}, {y, -20000, 20000}, {z, -30000, 30000}]

Show[{P1, P2, P3}]
结果如下:
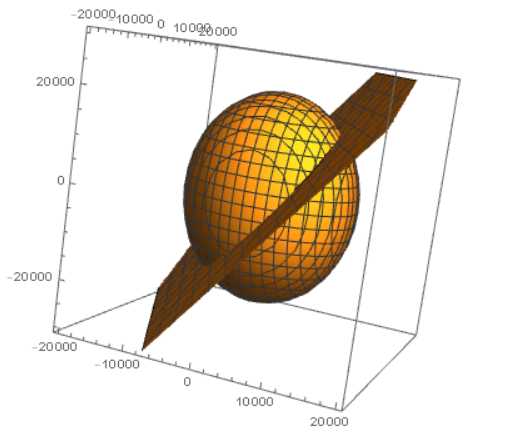
感觉有那么点意思了。
下面我们求出两个面相交的参数方程,使用Mathematica计算还是比较方便的。
列出以下三个方程:
1.8204 x + 0.81444 y - z - 20.3705 = 0
x^2/11831.96520773810 + y^2/7748.536683771910 + z^2/37674.40280711745 - 14504.08387417353 = 0
z = 23375.89994468299 Sin[t]
这里23375.89994468299 通过sqrt(14504.08387417353*37674.40280711745)求出来的,z是在这个范围内变动的。
使用Mathematica解算如下:
Solve[{1.8204 x + 0.81444 y - z - 20.3705 == 0,
  x^2/11831.96520773810 + y^2/7748.536683771910 +
    z^2/37674.40280711745 - 14504.08387417353 == 0,
  z == 23375.89994468299 Sin[t]}, {x, y, z}]
结果:
{{x -> 2.5336*10^-43 (3.90483*10^43 + 4.48093*10^46 Sin[t] - 7.40177*10^18 Sqrt[
       5.65524*10^54 - 8.37291*10^51 Sin[t] - 1.04594*10^55 Sin[t]^2]),
  y -> 1.2668*10^-42 (2.28816*10^42 + 2.62575*10^45 Sin[t] + 3.30882*10^18 Sqrt[
       5.65524*10^54 - 8.37291*10^51 Sin[t] - 1.04594*10^55 Sin[t]^2]),
  z -> 23375.9 Sin[t]},
 {x -> 2.5336*10^-43 (3.90483*10^43 + 4.48093*10^46 Sin[t] + 7.40177*10^18 Sqrt[
       5.65524*10^54 - 8.37291*10^51 Sin[t] - 1.04594*10^55 Sin[t]^2]),
  y -> 1.2668*10^-42 (2.28816*10^42 + 2.62575*10^45 Sin[t] -  3.30882*10^18 Sqrt[
       5.65524*10^54 - 8.37291*10^51 Sin[t] - 1.04594*10^55 Sin[t]^2]),
  z -> 23375.9 Sin[t]}}
求到这里,这个参数方程已经求出来的,下面我画出来验证一下。
matlab代码如下:
clear all;
close all;
clc;

xx=[];yy=[];zz=[];

for t=0:0.001:2*pi
    x=2.5336*10^(-43) *(3.90483*10^43 + 4.48093*10^46*sin(t) -  7.40177*10^18*sqrt(5.65524*10^54 - 8.37291*10^51* sin(t) - 1.04594*10^55*sin(t).^2));
    y=1.2668*10^(-42) *(2.28816*10^42 + 2.62575*10^45*sin(t) + 3.30882*10^18*sqrt(5.65524*10^54 - 8.37291*10^51 *sin(t) - 1.04594*10^55* sin(t).^2));
    z=23375.9* sin(t);

    if(sqrt(5.65524*10^54 - 8.37291*10^51 *sin(t) - 1.04594*10^55* sin(t).^2)>0)
        xx=[xx x];
        yy=[yy y];
        zz=[zz z];
    end
end

for t=0:0.001:2*pi
    x=2.5336*10^(-43) *(3.90483*10^43 + 4.48093*10^46*sin(t) +  7.40177*10^18*sqrt(5.65524*10^54 - 8.37291*10^51* sin(t) - 1.04594*10^55*sin(t).^2));
    y=1.2668*10^(-42) *(2.28816*10^42 + 2.62575*10^45*sin(t) - 3.30882*10^18*sqrt(5.65524*10^54 - 8.37291*10^51 *sin(t) - 1.04594*10^55* sin(t).^2));
    z=23375.9* sin(t);
    if(sqrt(5.65524*10^54 - 8.37291*10^51 *sin(t) - 1.04594*10^55* sin(t).^2)>0)
        xx=[xx x];
        yy=[yy y];
        zz=[zz z];
    end
end

plot3(xx,yy,zz,‘.‘)

x=[4272.199656,8091.936548,9250.537919,7326.513290,4775.406342];
y=[-9122.847094,-8215.105235,-4377.145579,3801.632308,7889.177050];
z=[332.461913,8019.448934,13254.361230,16413.922920,15098.049929];
hold on
plot3(x,y,z,‘ro‘)
结果如下:
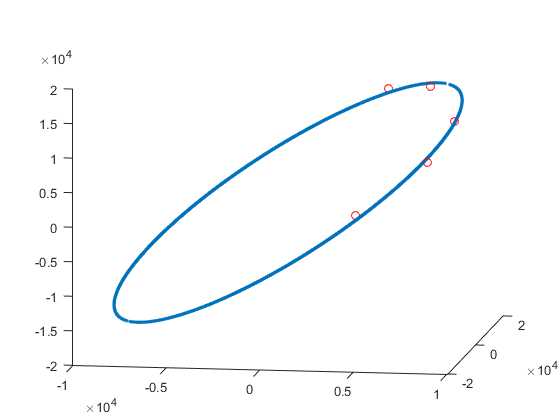
可以看出,点基本都在椭圆周围,效果不错,下面多用几组原始点对比看看:
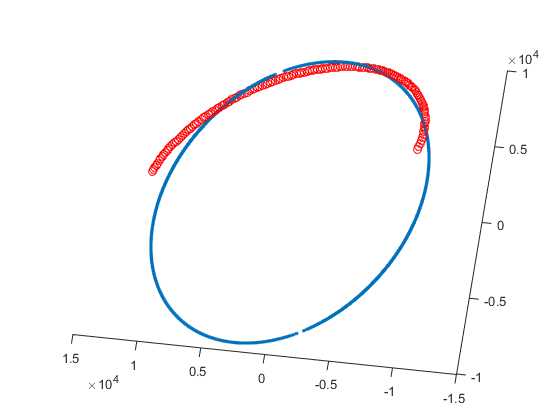
呵呵,这就比较尴尬了,好像不怎么一样哦。
毕竟,这里只用了5个点,拟合点数多一些效果应该会好些吧 : )
以上是关于Matlab&Mathematica对三维空间上的点进行椭圆拟合的主要内容,如果未能解决你的问题,请参考以下文章