OpenGL——折线图柱状图饼图绘制
Posted farewell-farewell
tags:
篇首语:本文由小常识网(cha138.com)小编为大家整理,主要介绍了OpenGL——折线图柱状图饼图绘制相关的知识,希望对你有一定的参考价值。
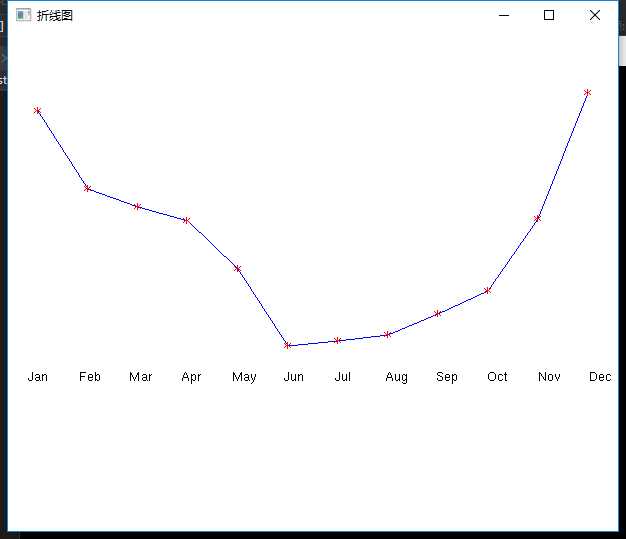
折线图绘制代码:
#include<iostream>

//旧版本 固定管线
#include<Windows.h>
#include <GL/glut.h>
//新版本 可编程管线
/*#define GLEW_STATIC
#include <GL/glew.h>
#include<GLFWglfw3.h>
*/

using namespace std;

GLsizei winWidth = 610, winHeight = 500;
GLint xRaster = 25, yRaster = 150;

GLubyte label[36] = { ‘J‘,‘a‘,‘n‘, ‘F‘,‘e‘,‘b‘, ‘M‘,‘a‘,‘r‘, ‘A‘,‘p‘,‘r‘,
                        ‘M‘,‘a‘,‘y‘, ‘J‘,‘u‘,‘n‘, ‘J‘,‘u‘,‘l‘, ‘A‘,‘u‘,‘g‘,
                        ‘S‘,‘e‘,‘p‘, ‘O‘,‘c‘,‘t‘, ‘N‘,‘o‘,‘v‘, ‘D‘,‘e‘,‘c‘ };

GLint dataValue[12] = { 420,342,324,310,262,185,190,196,217,240,312,438 };

void init()
{
    //窗口背景为白色
    glClearColor(1, 1, 1, 1);
    glMatrixMode(GL_PROJECTION);
    gluOrtho2D(0.0, 610.0, 0.0, 500.0);
}

void lineGraph()
{
    GLint month, k;
    GLint x = 30;

    glClear(GL_COLOR_BUFFER_BIT);
    //蓝色
    glColor3f(0.0, 0.0, 1.0);
    glBegin(GL_LINE_STRIP);   //画出折线段
    for (k = 0; k < 12; k++) {
        glVertex2i(x + k * 50, dataValue[k]);
    }
    glEnd();

    //红色
    glColor3f(1.0, 0.0, 0.0);     //标注各点
    for (k = 0; k < 12; k++) {
        glRasterPos2i(xRaster + k * 50, dataValue[k] - 4);
        glutBitmapCharacter(GLUT_BITMAP_9_BY_15, ‘*‘);
    }

    //黑色
    glColor3f(0.0, 0.0, 0.0);      //横坐标说明
    xRaster = 20;
    for (month = 0; month < 12; month++) {
        glRasterPos2i(xRaster, yRaster);
        for (k = 3 * month;k < 3 * month + 3;k++) {
            glutBitmapCharacter(GLUT_BITMAP_HELVETICA_12, label[k]);
            xRaster += 17;
        }
    }
    glFlush();
}

void winReshapeFcn(GLint newWidth, GLint newHeight)
{
    glMatrixMode(GL_PROJECTION);
    glLoadIdentity();
    gluOrtho2D(0, GLdouble(newWidth), 0, GLdouble(newHeight));
    glClear(GL_COLOR_BUFFER_BIT);
}

int main(int argc, char* argv[])
{

    //对GLUT进行初始化,并处理所有的命令行参数
    glutInit(&argc, argv);
    //指定使用RGBA模式还是颜色索引模式,还可指定使用单缓冲还是双缓冲窗口
    glutInitDisplayMode(GLUT_RGB | GLUT_SINGLE);
    //指定了窗口左上角在屏幕上的位置
    glutInitWindowPosition(100, 100);
    //制定了窗口大小(以像素为单位)
    glutInitWindowSize(winWidth, winHeight);
    //创建支持opengl渲染的窗口,在调用glutMainLoop函数前,窗口没有显示
    glutCreateWindow("折线图");
    init();
    //显示回调函数
    //每当GLUT确定一个窗口的内容需要重新显示时,通过glutDisplayFunc()注册的那个回调函数就会被执行
    glutDisplayFunc(lineGraph);
    glutReshapeFunc(winReshapeFcn);
    //启动程序,所有窗口这时显示
    glutMainLoop();

    system("pause");
    return 0;


}
运行结果:

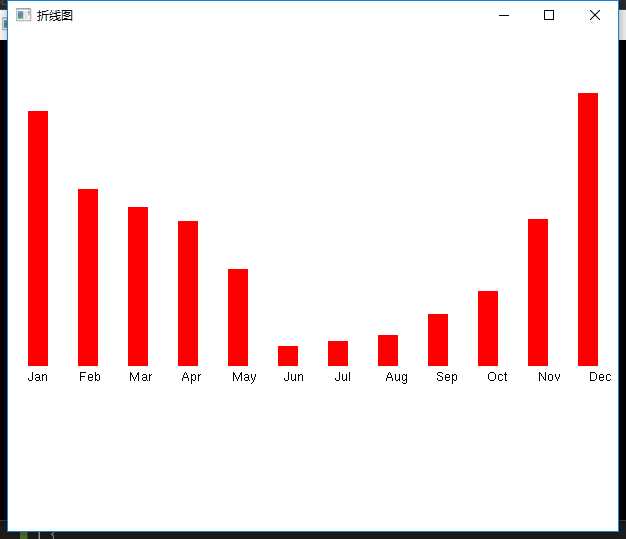
柱状图代码:
void barChart()
{
    GLint month, k;

    glClear(GL_COLOR_BUFFER_BIT);

    //红色
    glColor3f(1.0, 0.0, 0.0);
    for (k = 0; k < 12; k++) {
        glRecti(20 + k * 50, 165, 40 + k * 50, dataValue[k]);
    }

    //黑色
    glColor3f(0.0, 0.0, 0.0);      //横坐标说明
    xRaster = 20;
    for (month = 0; month < 12; month++) {
        glRasterPos2i(xRaster, yRaster);
        for (k = 3 * month;k < 3 * month + 3;k++) {
            glutBitmapCharacter(GLUT_BITMAP_HELVETICA_12, label[k]);
            xRaster += 17;
        }
    }
    glFlush();
}
运行结果:

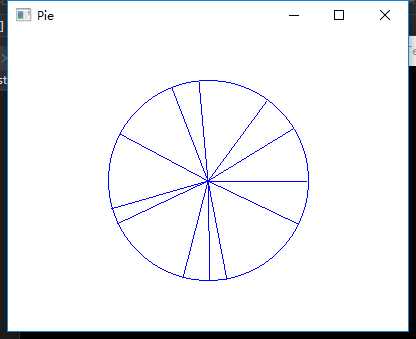
饼图代码:
#include<iostream>
#include <math.h>
//旧版本 固定管线
#include<Windows.h>
#include <GL/glut.h>
//新版本 可编程管线
/*#define GLEW_STATIC
#include <GL/glew.h>
#include<GLFWglfw3.h>
*/

using namespace std;

const GLdouble twoPi = 6.283185;

class scrPt {
public:
    scrPt() {
        x = y = 0;
    }
    GLint x, y;
    void setCoords(GLint xCoordValue, GLint yCorrdValue) {
        x = xCoordValue;
        y = yCorrdValue;
    }
    GLint getx() const {
        return x;
    }
    GLint gety() const {
        return y;
    }
    void incrementx() {
        x++;
    }
    void incrementy() {
        y--;
    }

};

GLsizei winWidth = 400, winHeight = 300;


void init()
{
    //窗口背景为白色
    glClearColor(1, 1, 1, 1);
    glMatrixMode(GL_PROJECTION);
    gluOrtho2D(0.0, 200.0, 0.0, 150.0);
}

void setPixel(GLint xCoord, GLint yCoord)
{
    glBegin(GL_POINTS);
    glVertex2i(xCoord, yCoord);
    glEnd();
}


void circlePlotPoints(GLint xc, GLint yc, scrPt circPt)
{
    setPixel(xc + circPt.getx(), yc + circPt.gety());
    setPixel(xc - circPt.getx(), yc + circPt.gety());
    setPixel(xc + circPt.getx(), yc - circPt.gety());
    setPixel(xc - circPt.getx(), yc - circPt.gety());
    setPixel(xc + circPt.gety(), yc + circPt.getx());
    setPixel(xc - circPt.gety(), yc + circPt.getx());
    setPixel(xc + circPt.gety(), yc - circPt.getx());
    setPixel(xc - circPt.gety(), yc - circPt.getx());
}

//中心画圆算法
void circleMidpoint(GLint xc, GLint yc, GLint radius)
{
    scrPt circPt;
    GLint p = 1 - radius;//中点参数初值
    circPt.setCoords(0, radius);
    circlePlotPoints(xc, yc, circPt);
    while (circPt.getx() < circPt.gety()) {
        circPt.incrementx();
        if (p < 0)
            p += 2 * circPt.getx() + 1;
        else {
            circPt.incrementy();
            p += 2 * (circPt.getx() - circPt.gety()) + 1;
        }
        circlePlotPoints(xc, yc, circPt);
    }
}


void pieChart()
{
    scrPt circCtr, piePt;
    GLint radius = winWidth / 4;
    GLdouble sliceAngle, previousSliceAngle = 0.0;

    GLint k, nSlices = 12;

    GLfloat dataValues[12] = { 10.0,7.0,13.0,5.0,13.0,14.0,
                            3.0,16.0,5.0,3.0,17.0,8.0 };
    GLfloat dataSum = 0.0;

    circCtr.x = winWidth / 2;
    circCtr.y = winHeight / 2;
    circleMidpoint(circCtr.x,circCtr.y, radius);

    for (k = 0;k < nSlices;k++) {
        dataSum += dataValues[k];
    }

    for (k = 0; k < 12; k++) {
        sliceAngle = twoPi * dataValues[k] / dataSum + previousSliceAngle;
        piePt.x = circCtr.x + radius * cos(sliceAngle);
        piePt.y = circCtr.y + radius * sin(sliceAngle);
        glBegin(GL_LINES);
        glVertex2i(circCtr.x, circCtr.y);
        glVertex2i(piePt.x, piePt.y);
        glEnd();
        previousSliceAngle = sliceAngle;
    }

}

void displayFcn()
{
    glClear(GL_COLOR_BUFFER_BIT);
    glColor3f(0.0, 0.0, 1.0);
    pieChart();
    glFlush();
}

void winReshapeFcn(GLint newWidth, GLint newHeight)
{
    glMatrixMode(GL_PROJECTION);
    glLoadIdentity();
    gluOrtho2D(0.0, GLdouble(newWidth), 0.0, GLdouble(newHeight));
    glClear(GL_COLOR_BUFFER_BIT);

    winWidth = newWidth;
    winHeight = newHeight;
}

int main(int argc, char* argv[])
{

    //对GLUT进行初始化,并处理所有的命令行参数
    glutInit(&argc, argv);
    //指定使用RGBA模式还是颜色索引模式,还可指定使用单缓冲还是双缓冲窗口
    glutInitDisplayMode(GLUT_RGB | GLUT_SINGLE);
    //指定了窗口左上角在屏幕上的位置
    glutInitWindowPosition(100, 100);
    //制定了窗口大小(以像素为单位)
    glutInitWindowSize(winWidth, winHeight);
    //创建支持opengl渲染的窗口,在调用glutMainLoop函数前,窗口没有显示
    glutCreateWindow("Pie");
    init();
    //显示回调函数
    //每当GLUT确定一个窗口的内容需要重新显示时,通过glutDisplayFunc()注册的那个回调函数就会被执行
    glutDisplayFunc(displayFcn);
    glutReshapeFunc(winReshapeFcn);
    //启动程序,所有窗口这时显示
    glutMainLoop();

    system("pause");
    return 0;


}
运行结果:

以上是关于OpenGL——折线图柱状图饼图绘制的主要内容,如果未能解决你的问题,请参考以下文章