D3(v5) in TypeScript 坐标轴之 饼状图生成
Posted kbaoq
tags:
篇首语:本文由小常识网(cha138.com)小编为大家整理,主要介绍了D3(v5) in TypeScript 坐标轴之 饼状图生成相关的知识,希望对你有一定的参考价值。
饼状图生成时依旧遇到了类型问题,记录如下:
import * as d3 from ‘d3‘;
import * as React from ‘react‘;

class TestGraph extends React.Component {
    public componentDidMount() {
        const marge = {
            top: 60,
            bottom: 60,
            left: 60,
            right: 60
        };
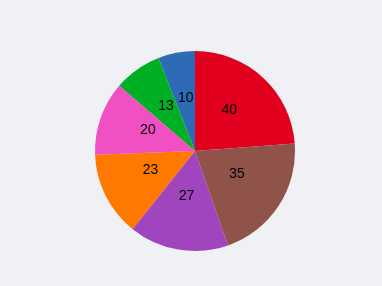
        const dataSet: any[] = [10, 23, 13, 40, 27, 35, 20];
        const svg = d3.select("svg");
        const g = svg.append("g")
            .attr("transform", `translate(${marge.top},${marge.left})`);
        const width: any = svg.attr(‘width‘);
        const height: any = svg.attr(‘height‘);
        // 此处必须把.domain里的参数转为字符串数组,不然会报类型错误
        const colorScale: any = d3.scaleOrdinal()// 此处必须把colorScale类型设置为any,不然会在使用时报类型错误
            .domain(d3.range(dataSet.length).map(value => {
                return value.toString();
            }))
            .range(d3.schemeCategory10);

        const pie = d3.pie();
        const ir = 0;
        const or = 100;
        const arcG: any = d3.arc()// 此处原理如上
            .innerRadius(ir)
            .outerRadius(or);
        const pirData = pie(dataSet);


        const gs = g.selectAll(".g")
            .data(pirData)
            .enter()
            .append("g")
            .attr("transform", `translate(${width / 2},${height / 2})`);

        gs.append("path")
            .attr(‘d‘, (d) => {// 此处为报错地方,需在上面设置arcG类型为any
                return arcG(d);
            })
            .attr(‘fill‘, (datum, index) => {// 同上
                return colorScale(index);
            });

        gs.append("text")
            .attr("transform", d => {// 位置设在中心处
                return "translate(" + arcG.centroid(d) + ")";
            })
            .attr("text-anchor", "middle")
            .text(d => {// 此处需要转换返回值为string
                return d.data.toString();
            })
    }

    public render() {
        return (
            <svg width={960} height={600}/>
        )
    }
}

export default TestGraph;
最终效果如下:

以上是关于D3(v5) in TypeScript 坐标轴之 饼状图生成的主要内容,如果未能解决你的问题,请参考以下文章