监控Prometheus的概述安装与服务发现
Posted 可乐卷儿
tags:
篇首语:本文由小常识网(cha138.com)小编为大家整理,主要介绍了监控Prometheus的概述安装与服务发现相关的知识,希望对你有一定的参考价值。
文章目录
一、Prometheus的概述
1、简介
Prometheus是一款具备开源的监控,是一种TSDB(时序数据库),复制于谷歌的borgmon监控系统,对k8s容器的监控非常适用。Prometheus可以很好地记录任何纯数字时间序列。是位可靠性而设计的,既适用于以机器为中心的监视,也适用于高度动态的面向服务的体系结构的监视,系统中断期间依旧可以监控使用的系统。
2、优点
- 可以自定义多维数据模型,储存更加高效
- 具有灵活且强大的查询语句(PromQL),不依赖分布式储存
- 支持单节点工作,可通过pull方式采集时序数据
- 可以通过push gateway进行时序列数据库推送
- 可以通过服务发现或静态配置去获取要采集的目标服务器(sd server discover)多种可视化图表及仪表盘支持
3、"抓取"数据的方式
首先收集数据分为白盒监控、黑盒监控
- 白盒监控:自省方式,被监控端内部,可以自己生成指标,只要等待监控系统来采集时提供出去即可
- 黑盒监控:对于被监控系统没有侵入性,对其没有直接"影响",这种类似于基于探针机制进行监控(snmp协议)
其次Prometheus属于白盒监控,支持通过以下三种类型的途径从木板上抓取指标数据:
- Exporters :指标暴露器;工作在被监控端,周期性的抓取数据并转换为pro兼容格式等待prometheus来收集,自己并不推送
- Instrumentation:应用程序内置的指标暴露器;指被监控对象内部自身有数据收集、监控的功能,只需要prometheus直接去获取
- Pushgateway:专用于收集短周期、临时的任务,等待prometheus拉取
4、Prometheus生态组件
- Prometheus Server:服务端;收集和储存时间序列数据;
- Client Library:客户端库;目的在于为那些期望原生提供Instrumentation功能的应用程序提供便捷的开发途径
- Exporters :指标暴露器
- Push Gateway:接收那些通常由短期作业生成的指标数据的网关
- Prometheus Service Discovery(sd):服务动态发现待监控的Target,发送告警信息
- Prometheus scrape:数据采集器
- Alertmanager:由告警规则对接
- Instrumentation:应用程序内置的指标暴露器
- Data Visualization(Dashboards):(prome-UI界面)
二、Prometheus部署
| 服务器分配主机名 | 地址 | 安装包 |
|---|---|---|
| prometheus | 192.168.35.40 | prometheus-2.27.1.linux-amd64.tar.gz |
| server1 | 192.168.35.10 | node_exporter-1.1.2.linux-amd64.tar.gz |
| server2 | 192.168.35.20 | |
| server3 | 192.168.35.30 |
1、准备工作关闭防火墙及安全机制,修改主机名
hostnamectl set-hostname prometheus		#其他主机分别设置server1.2.3
systemctl stop firewalld
systemctl disable firewalld
setenforce 0
vim /etc/reslove.conf
nameserver 114.114.114.114
ntpdate ntp1.aliyun.com 		#时间同步;时间同步必须要做,不然会报错
2、安装包下载
方法一:同步源的方式下载
cat > letc/ yum.repos.d/prometheus.repo <<EOF
[prometheus]
name=prometheus
baseurl=https://packagecloud.io/prometheus-rpm/release/el/basearch
repo gpgcheck=1
enabled-1
gpgkey=https://packagecloud.io/prometheus-rpm/release/gpgkeyhttps://raw.githubusercontent.com/lest/prometheus-rpm/master/RPM-GPG-KEY-prometheus-rpmgpgcheck=1 metadata_expire=300
EOF
方法二:使用我提供的腾讯云盘下载解压或者官网下载
tar -zxvf prometheus-2.27.1.linux-amd64.tar.gz -C /usr/local
cd prometheus-2.27.1.linux-amd64/
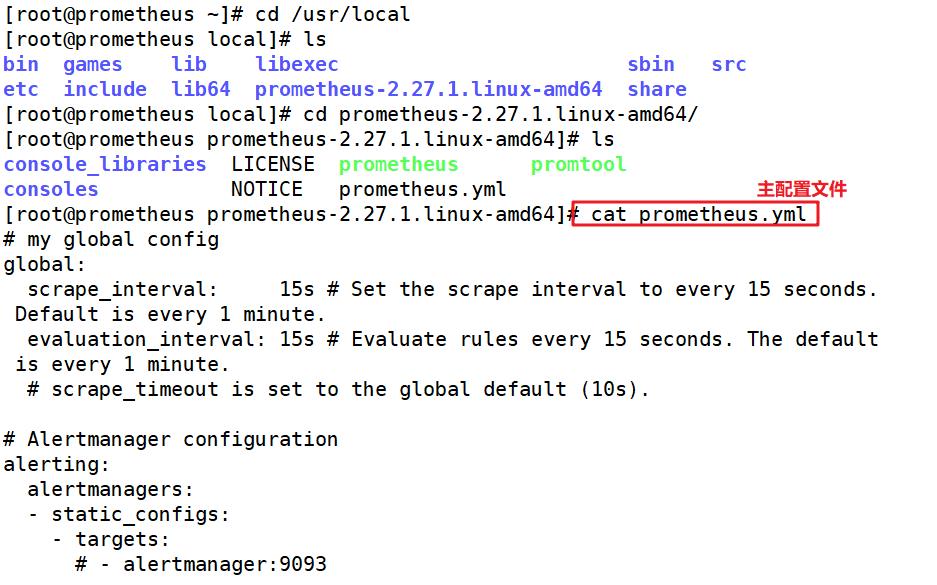
vim prometheus.yml
my global config
global: ##全局组件
scrape_interval: 15s # Set the scrape interval to every 15 seconds. Default is every 1 minute. ##每隔多久抓取一次指标,不设置默认1分钟
evaluation_interval: 15s # Evaluate rules every 15 seconds. The default is every 1 minute. ##内置告警规则的评估周期
#scrape_timeout is set to the global default (10s).
# Alertmanager configuration ##对接的altermanager(第三方告警模块)
alerting:
alertmanagers:
- static_configs:
- targets:
- alertmanager:9093
# Load rules once and periodically evaluate them according to the global 'evaluation_interval'.
rule_files: ##告警规则;告警规则可以使用yml规则去书写
- "first_rules.yml"
- "second_rules.yml"
# A scrape configuration containing exactly one endpoint to scrape:
# Here it's Prometheus itself.
scrape_configs: ##数据采集模块
# The job name is added as a label `job=<job_name>` to any timeseries scraped from this config. ##对于所抓取的指标数据采集的来源在意job_name来定义
- job_name: 'prometheus' ##对于指标需要打上的标签,对于PrometheusSQL(查询语句)的标签:比如prometheustarget='values'
# metrics_path defaults to '/metrics' ##收集数据的路径;展示使用metrics模式
# scheme defaults to 'http'. ##默认抓取的方式是http
static_configs: ##对于Prometheus的静态配置监听端口具体数据收集的位置 默认的端口9090
- targets: ['localhost:9090']
3、运行服务查看端口是否开启
./prometheus		##直接开启Prometheus
netstat -antp | grep 9090		##另开一个终端查看9090端口

4、访问web页面(表达式浏览器)
查看表达式浏览器
访问192.168.35.40:9090 ##查看采集数据 Prometheus会进行周期性的采集数据(完整的),多次周期性(在一个时间区间内)采集的数据集合,形成时间序列

访问192.168.35.40:9090/metrics:查看prometheus自带的内键指标

5、部署监控其他节点
prometheus想要监控其他节点,则需要借助node_exporter,下载地:https://prometheus.io/docs/concepts/data_model/,腾讯云盘prometheus安装包
5.1、解压安装包,命令优化路径,设置服务控制,开启服务
server1,2,3节点操作:上传压缩包加载node_exporter
tar zxvf node_exporter-1.1.2.linux-amd64.tar.gz
cd node_exporter-1.1.2.linux-amd64
cp node_exporter /usr/local/bin
开启服务方法一:
./node_exporter --help		##可以查看命令可选项
服务管理方式utilfile(文件读取工具)
[Unit]
Description=node_exporter
Documentation=https:/prometheus.io/
After=network.targets
[serveice]
Type=simple
User=prometheus
ExecStart=/usr/local/bin/node_exporter \\
    --collector.ntp \\
    --collector.mountstats \\
    --collector.systemd \\
    --collertor.tcpstat
ExecReload=/bin/kill -HUP $MAINPID
TimeoutStopSec=20s
Restart=always
[Install]
WantedBy=multi-user.target
开启服务方法二,直接启动
./node_exporter
netstat -antp | grep 9100		##再开一个会话查询端口号

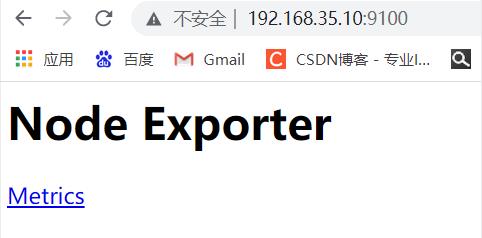
访问192.168.35.10:9100/metrics 查看抓取内容在这里插入代码片在这里插入代码片
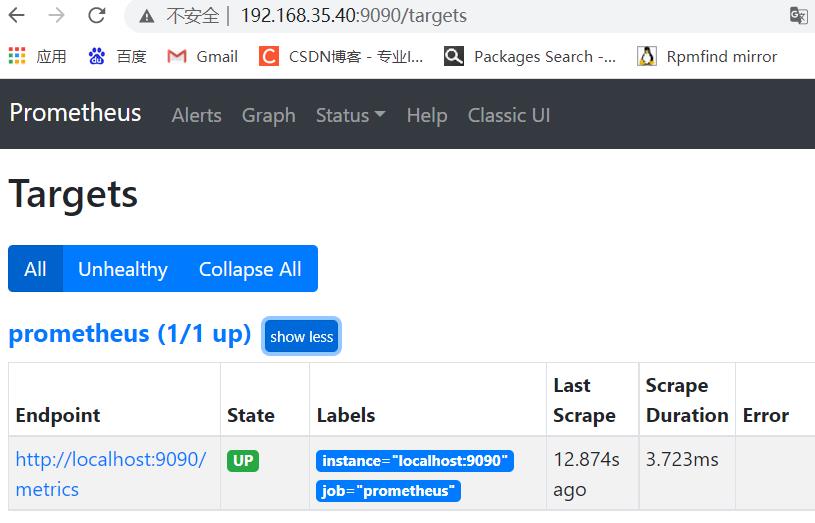
访问http://192.168.35.40:9090/ 点击—>status—>targets
5.2、加入其他节点监控端
需要在192.168.35.40 prometheus服务端停止prometheus修改配置文件添加静态targets才能使得server1节点加入
cd /usr/local/prometheus-2.27.1.linux-amd64/
vim prometheus.yml		##配置文件的最后添加以下内容
  - job_name: 'nodes'
    static_configs:
    - targets:
      - 192.168.35.10:9100
      - 192.168.35.20:9100
      - 192.168.35.30:9100

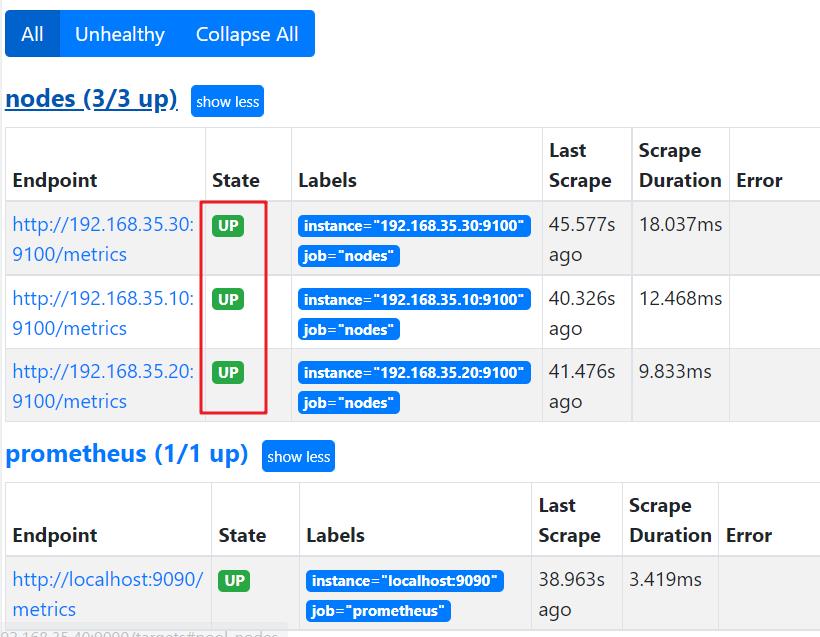
5.3、启动服务
./prometheus	##启动服务
查看页面http://192.168.35.40:9090/targets#pool-nodes
6、表达式浏览器(promQL 过滤使用)
6.1、1、表达式浏览器常规使用
在prometheusUI控制台上可以进行数据过滤
简单的用法:
node_cpu_seconds_total ##CPU使用总量
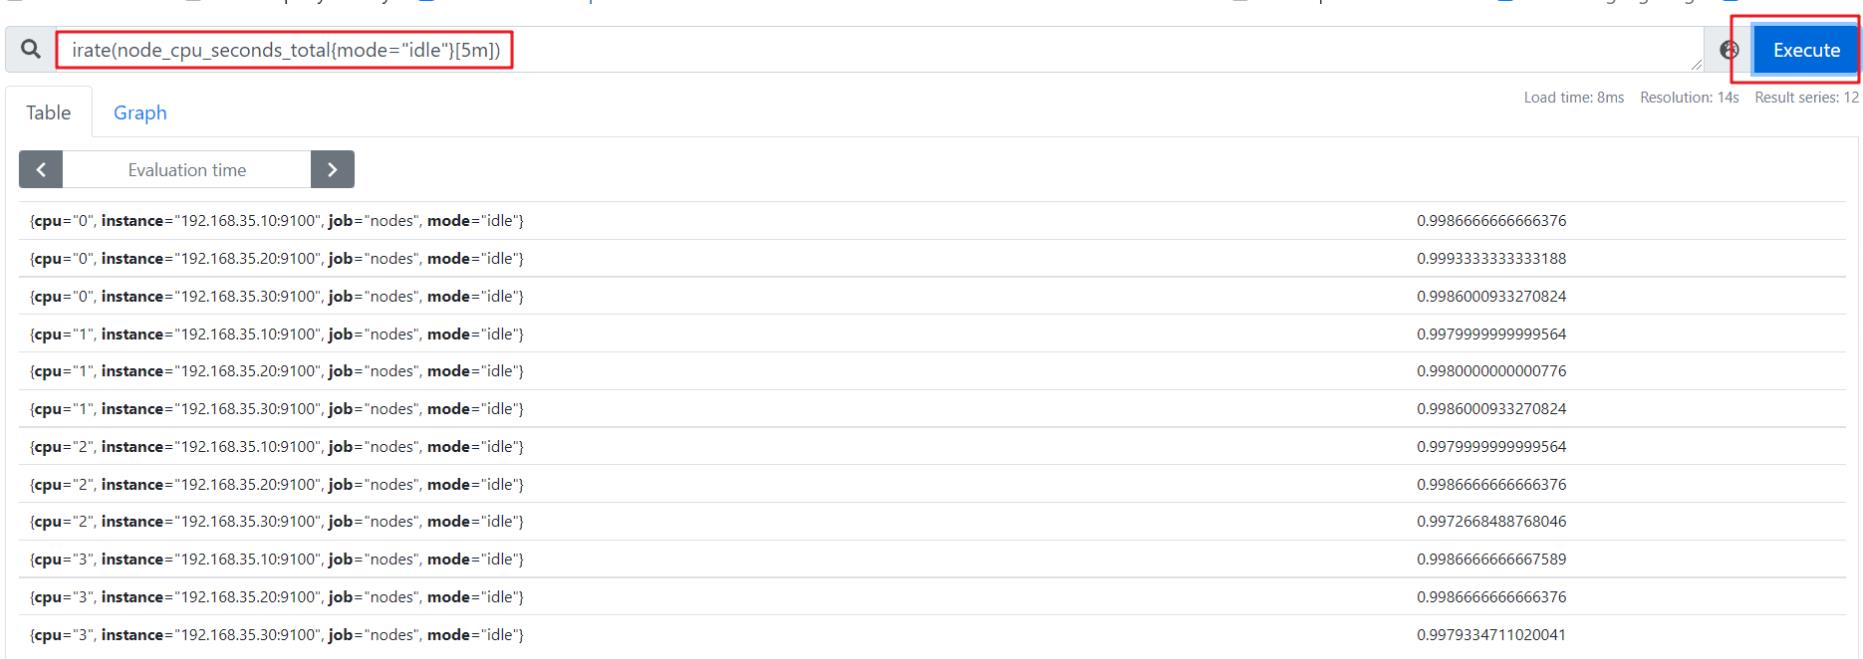
进阶1:
PromQL: irate(node_cpu_seconds_totalmode="idle"[5m]) ##计算过去5分钟内的CPU空闲速率
解析:
- irate:速率计算函数(灵敏度非常高)
- node_cpu_seconds_total:node节点CPU使用总量(指标)
- mode=“idle” 空闲指标(标签)
- 5m:过去的5分钟内,所有CPU空闲数的样本值,每个数值做速率运算
- mode=“idle” :整体称为标签过滤器
进阶2:
PromQL:(1- avg (irate(node_cpu_seconds_totalmode='idle'[5m]))by (instance))* 100 ##每台主机CPU 在5分组内的平均使用率
解析:
- avg:平均值
- avg (irate(node_cpu_seconds_totalmode=‘idle’[5m]):可以理解为CPU空闲量的百分比
- by (instance):表示的是所有节点
- (1- avg (irate(node_cpu_seconds_totalmode=‘idle’[5m]))by (instance))* 100:CPU 5分钟内的平均使用率
三、部署service discovery服务发现
1、Prometheus的服务发现
- 基于文件的服务发现;
(定义一组资源“子”配置文件yaml格式 里面只存方需要采集的targets 信息,此种方式可以被pro动态获取到,而不需要重启) - 基于DNS的服务发现;(SRV形式)
- 基于API的服务发现:Kubernetes、Consul、Azure、重新标记
target重新打标
metric重新打标 - 基于K8S的服务发现
2、prometheus 服务发现机制
-
Prometheus Server的数据抓取工作于Pull模型,因而,它必需要事先知道各Target
的位置,然后才能从相应的Exporter或Instrumentation中抓取数据 -
对于小型的系统环境来说,通过static_configs指定各Target便能解决问题,这也是
最简单的配置方法;每个Targets用一个网络端点(ip:port)进行标识; -
对于中大型的系统环境或具有较强动态性的云计算环境来说,静态配置显然难以适用;
因此,Prometheus为此专门设计了一组服务发现机制,以便于能够基于服务注册中心(服务总线)自动发现、检测、分类可被监控的各Target,以及更新发生了变动的Target指标抓取的生命周期 -
在每个scrape_interval期间,Prometheus都会检查执行的作业(Job);这些作业首先会根据
Job上指定的发现配置生成target列表,此即服务发现过程;服务发现会返回一个Target列表,其中包含一组称为元数据的标签,这些标签都以" meta_"为前缀; -
服务发现还会根据目标配置来设置其它标签,这些标签带有"“前缀和后缀,b包括"scheme”
、" address"和" metrics path_",分别保存有target支持使用协议(http或https,默认为
http) 、 target的地址及指标的URI路径(默认为/metrics) ; -
若URI路径中存在任何参数,则它们的前缀会设置为" param"这些目标列表和标签会返回给
Prometheus,其中的一些标签也可以配置中被覆盖; -
配置标签会在抓取的生命周期中被重复利用以生成其他标签,例如,指标上的instance标
签的默认值就来自于address标签的值; -
对于发现的各目标,Prometheus提供了可以重新标记(relabel)目标的机会,它定义在
job配置段的relabel_config配置中,常用于实现如下功能
3、静态配置发现
#修改prometheus服务器上的配置为文件,指定targets的端口上面配置过
- job_name: 'nodes'
  static_config:
  - targets:
      - 192.168.35.10:9100
      - 192.168.35.20:9100
      - 192.168.35.30:9100
4、动态发现
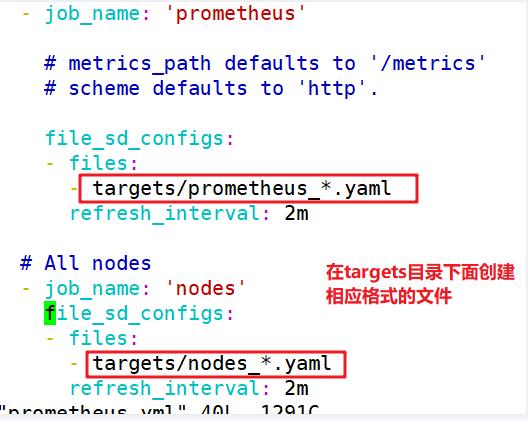
4.1、基于文件服务发现
基于文件的服务发现仅仅略优于静态配置的服务发现方式,它不依赖于任何平台或第三方服务,因而也是最为简单和通用的实现方式
prometheus server定期从文件中加载target信息(pro-server pull指标发现机制job_name 获取我要pull的对象target)文件可以只用json和yaml格式,它含有定义的target列表,以及可选的标签信息;以下第一配置,能够将prometheus默认的静态配置转换为基于文件的服务发现时所需的配置;(prometheus会周期性的读取、重载此文件中的配置,从而达到动态发现、更新的操作)
- 编写Prometheus.yml文件(prometheus服务端)
cd /usr/local/prometheus-2.27.1.linux-amd64/
mkdir files_sd
cd files_sd/
将修改后的prometheus.yml.0上传至该文件夹中,或者直接编写yml文件(文件在桌面prometheus内的targets文件夹内)
vim prometheus.yml		##截图内为:与静态Prometheus.yml文件区别的地方
以上是关于监控Prometheus的概述安装与服务发现的主要内容,如果未能解决你的问题,请参考以下文章