R语言基本绘图-plot参数:标题,坐标轴和颜色
Posted drliu
tags:
篇首语:本文由小常识网(cha138.com)小编为大家整理,主要介绍了R语言基本绘图-plot参数:标题,坐标轴和颜色相关的知识,希望对你有一定的参考价值。
标题
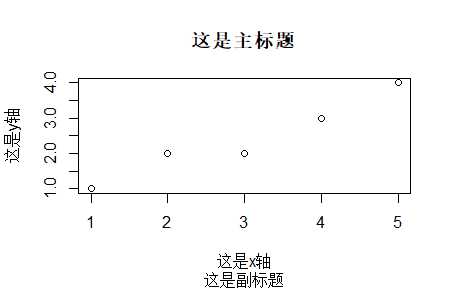
plot(c(1:2,2:4),main = "这是主标题",sub = "这是副标题",xlab = "这是x轴", ylab = "这是y轴")
坐标轴筛选
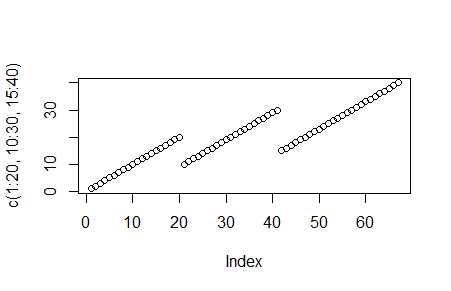
plot(c(1:20,10:30,15:40))
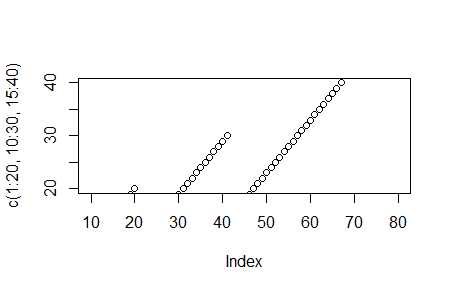
plot(c(1:20,10:30,15:40),xlim = c(10,80),ylim = c(20,40))
颜色
单一颜色
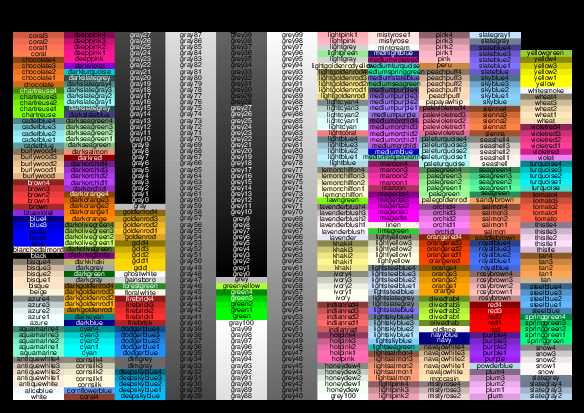
命令行输入colors(),可以查看所有可用的颜色(当前有657种颜色可供使用)
PDF版本下载地址
http://www.stat.columbia.edu/~tzheng/files/Rcolor.pdf
可在参数中直接使用颜色名或色值调用:
plot(c(1:20,10:30,15:40),col = "blue"))
颜色系统
R语言预设了五个基本配色系统,分别为rainbow,heat.colors,terrain.colors,topo.colors和cm.colors色阶如下
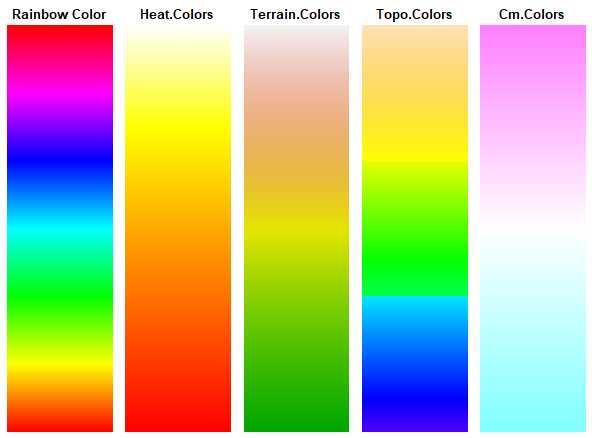
实现脚本[1]
par(mfrow=c(1,5),mar=c(0.5,0.5,2,0.5),xaxs="i",yaxs="i")
n<-1000
barplot(rep(1,times=n),col=rainbow(n),border=rainbow(n),horiz=T,axes=F,main="Rainbow Color")
barplot(rep(1,times=n),col=heat.colors(n),border=heat.colors(n),horiz=T,axes=F,main="Heat.Colors")
barplot(rep(1,times=n),col=terrain.colors(n),border=terrain.colors(n),horiz=T,axes=F,main="Terrain.Colors")
barplot(rep(1,times=n),col=topo.colors(n),border=topo.colors(n),horiz=T,axes=F,main="Topo.Colors")
barplot(rep(1,times=n),col=cm.colors(n),border=cm.colors(n),horiz=T,axes=F,main="Cm.Colors")
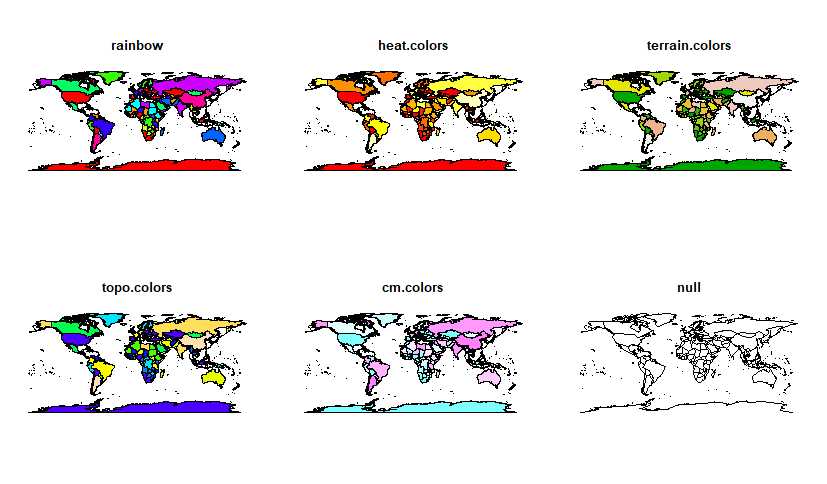
绘制图形时可做如下应用:
par(mfrow=c(2,3),mar=c(0.5,0.5,0.5,0.5),
n = 10
map("world",fill = T, col = rainbow(n)); title("rainbow")
map("world",fill = T, col = heat.colors(n)); title("heat.colors")
map("world",fill = T, col = terrain.colors(n));title("terrain.colors")
map("world",fill = T, col = topo.colors(n));title("topo.colors")
map("world",fill = T, col = cm.colors(n));title("cm.colors")
其他方式
设置基本配色时,可通过scale包下的show_col()预览颜色,或通过Colors Litehttps://www.colorlite.de/?lang=en【官方网站】https://www.onlinedown.net/soft/982914.htm【国内】取色;还可用颜色网站选色,比较经典的有colorbrewer2https://colorbrewer2.org/#,encycolorpediahttps://encycolorpedia.cn/,中国色http://zhongguose.com/。
参考资料:
[1] https://www.sohu.com/a/147671603_466874
以上是关于R语言基本绘图-plot参数:标题,坐标轴和颜色的主要内容,如果未能解决你的问题,请参考以下文章