Matplotlib的一些小细节——Legend图例
Posted zjx-pku
tags:
篇首语:本文由小常识网(cha138.com)小编为大家整理,主要介绍了Matplotlib的一些小细节——Legend图例相关的知识,希望对你有一定的参考价值。
Legend 图例
在Matplotlib中绘制多个图线时,需要在图表中说明每条曲线的含义,这时就用到了图例Legend。
使用方法
- 在
plt.plot中添加label属性(不添加也可,但是需要在plt.legend中添加) - 在
plt.plot之后添加plt.legend(handles=,labels=,loc=)
相应参数及注意事项
plt.legend(handles=,labels=,loc=)
-
loc,缺省为‘best‘‘best‘自动选择最空白的位置,并会随着图像大小变化调整位置‘upper right‘‘upper left‘‘center right‘‘center left‘‘lower right‘‘lower left‘
-
handles
是列表类型,传入需要标注的图线对象
line1, = plt.plot(x,y,color=‘blue‘,label=‘hello‘)
line2 = plt.plot(x,y2,color=‘red‘)
plt.legend(handles=[line1])
缺省为所有的图线对象
注意:图线对象后必须有逗号,如line1,=...
labels
是列表类型,传入对应于handles中图线的label,会覆盖掉plt.plot中的label
代码实例及运行结果
from matplotlib import pyplot as plt
import numpy as np
#1、参数
x = np.linspace(-1,2,50)
y1 = 2*x
y2 = x**2
#2、设置区间
plt.xlim((-1,2))
plt.ylim((-2,3))
#3、设置坐标轴标签
plt.xlabel(‘I am x‘)
plt.ylabel(‘I am y‘)
#4、设置坐标轴的单位长度
x_ticks = np.linspace(-1,2,9)
plt.xticks(x_ticks)
plt.yticks([-2,-1,0,2,4],[r‘$very bad$‘,r‘$bad$‘,r‘$plain$‘,r‘$very good$‘,r‘$alpha$‘])
#5、绘制图线,注意label属性用于后面生成图例
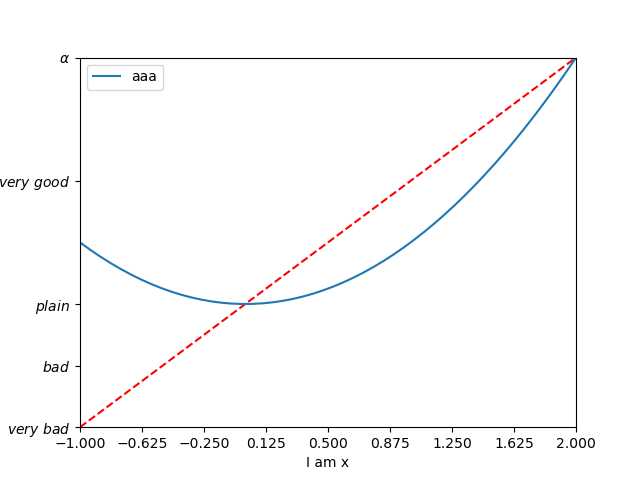
line1, = plt.plot(x,y1,color=‘r‘,linestyle=‘--‘,label=‘up‘)
line2, = plt.plot(x,y2,label=‘down‘)
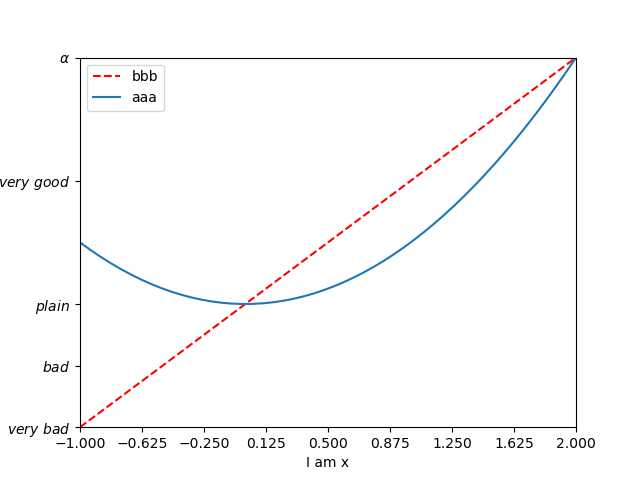
#6、生成图例
plt.legend(handles=[line1,line2],labels=[‘bbb‘,‘aaa‘])
plt.show()
以上是关于Matplotlib的一些小细节——Legend图例的主要内容,如果未能解决你的问题,请参考以下文章