matplotlib绘制直方图
Posted kmirror
tags:
篇首语:本文由小常识网(cha138.com)小编为大家整理,主要介绍了matplotlib绘制直方图相关的知识,希望对你有一定的参考价值。
import matplotlib.pyplot as plt
import matplotlib.font_manager as fm

a = [131, 98, 125, 131, 124, 139, 131, 117, 128, 108, 135, 138, 131, 102, 107, 114, 119, 128, 121, 142, 127, 130, 124,
     101, 110, 116, 117, 110, 128, 128, 115, 99, 136, 126, 134, 95, 138, 117, 111, 80, 132, 124, 113, 150, 110, 117, 86,
     95, 144, 105, 126, 130, 126, 130, 126, 116, 123, 106, 112, 138, 123, 86, 101, 99, 136, 123, 117, 119, 105, 137,
     123, 128, 125, 104, 109, 134, 125, 127, 105, 120, 107, 129, 116, 108, 132, 103, 136, 118, 102, 120, 114, 105, 115,
     132, 145, 119, 121, 112, 139, 125, 138, 109, 132, 134, 155, 106, 117, 127, 144, 139, 139, 119, 140, 83, 110, 102,
     123, 107, 143, 115, 136, 118, 139, 123, 112, 118, 125, 109, 119, 133, 112, 114, 122, 109, 106, 123, 116, 131, 127,
     115, 118, 112, 135, 115, 146, 137, 116, 103, 144, 83, 123, 111, 110, 111, 100, 154, 136, 100, 118, 119, 133, 134,
     106, 129, 126, 110, 111, 109, 141, 120, 117, 106, 149, 122, 122, 110, 118, 127, 121, 114, 125, 126, 114, 140, 103,
     130, 141, 117, 106, 114, 121, 114, 133, 137, 92, 121, 112, 146, 97, 137, 105, 98, 117, 112, 81, 97, 139, 113, 134,
     106, 144, 110, 137, 137, 111, 104, 117, 100, 111, 101, 110, 105, 129, 137, 112, 120, 113, 133, 112, 83, 94, 146,
     133, 101, 131, 116, 111, 84, 137, 115, 122, 106, 144, 109, 123, 116, 111, 111, 133, 150]

# 计算组数
d = 5  # 组距 这里的组距必须是max(a) 和 min(a)的公约数,不如会溢出刻度
num_bins = int((max(a) - min(a)) / d)

# 设置图形大小
plt.figure(figsize=(20, 8), dpi=80)
plt.hist(a, num_bins, density=1)   # density = 1时是频率分布直方图,而不是频数


# 设置x轴的刻度
plt.xticks(range(min(a), max(a) + d, d))

plt.grid()
plt.show()
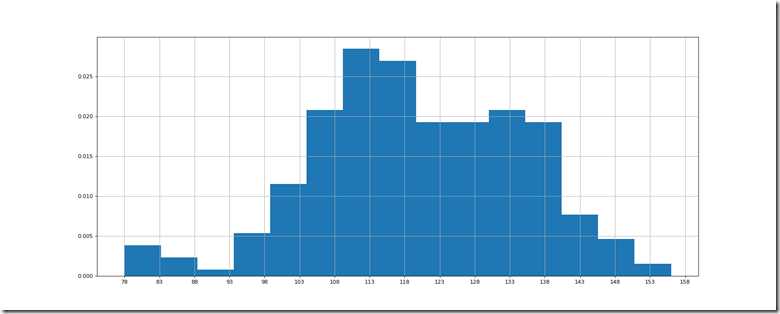
这节没啥要注意的唯独就是组距那可能会导致图形溢出
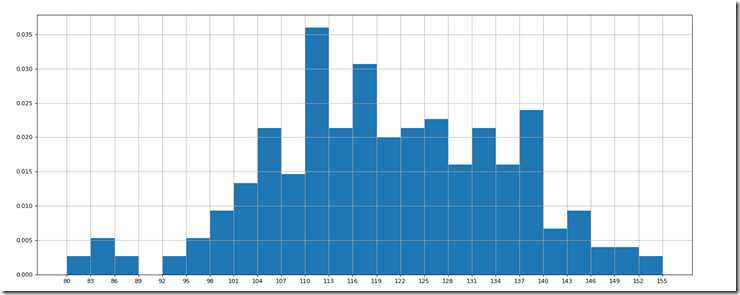
正常当d = 3时
不正常当d = 5时
暂时没找到原因
以上是关于matplotlib绘制直方图的主要内容,如果未能解决你的问题,请参考以下文章

