Matplotlib绘制散点图与条形图
Posted Thank CAT
tags:
篇首语:本文由小常识网(cha138.com)小编为大家整理,主要介绍了Matplotlib绘制散点图与条形图相关的知识,希望对你有一定的参考价值。
Matplotlib绘制散点图与条形图
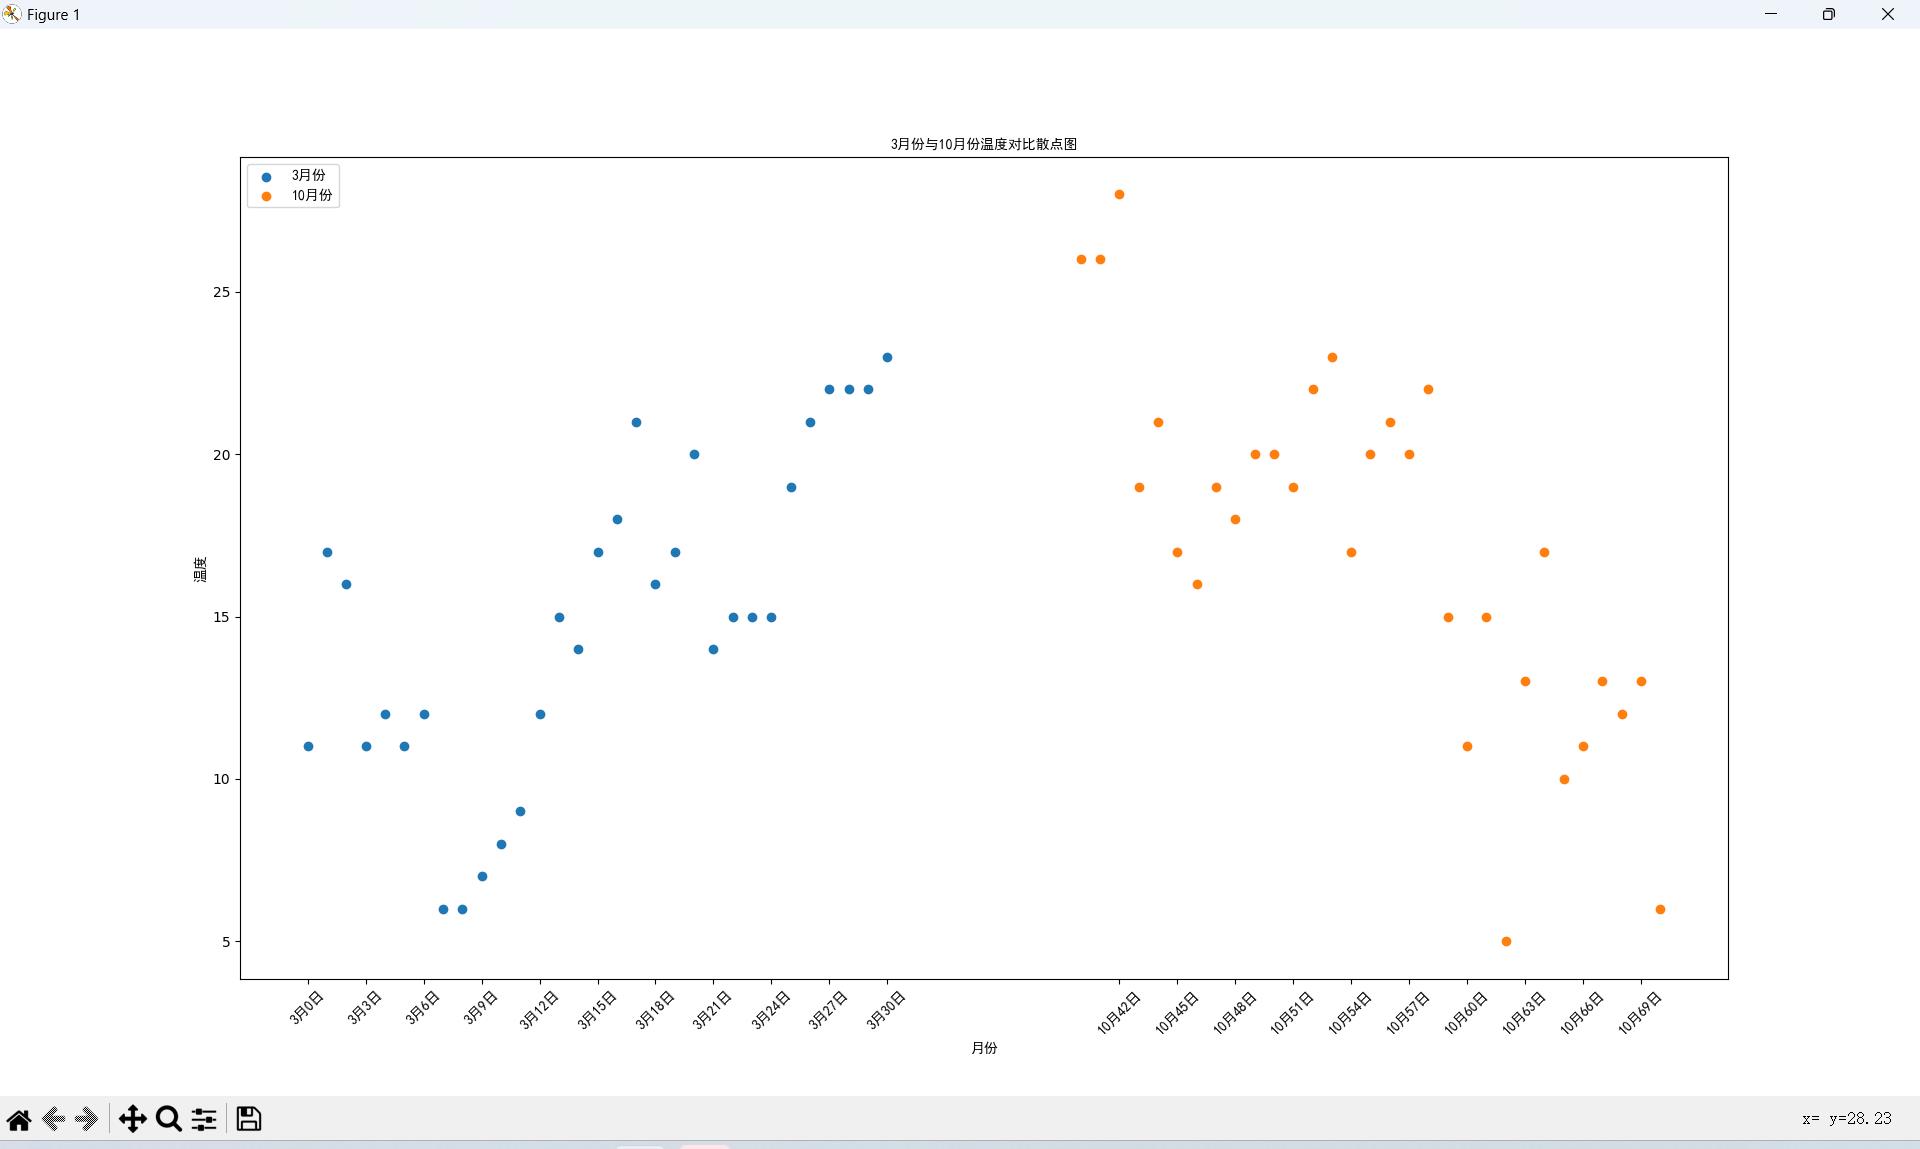
绘制散点图
# 绘制散点图

from matplotlib import pyplot as plt
from matplotlib import font_manager

# C:\\Windwos\\Fonts\\msyh.ttc
my_font = font_manager.FontProperties(fname="C:\\Windows\\Fonts\\simhei.ttf")

y_3 = [11, 17, 16, 11, 12, 11, 12, 6, 6, 7, 8, 9, 12, 15, 14, 17,
       18, 21, 16, 17, 20, 14, 15, 15, 15, 19, 21, 22, 22, 22, 23]
y_10 = [26, 26, 28, 19, 21, 17, 16, 19, 18, 20, 20, 19, 22, 23, 17,
        20, 21, 20, 22, 15, 11, 15, 5, 13, 17, 10, 11, 13, 12, 13, 6]

x_3 = range(0, 31)
x_10 = range(40, 71)

# 这是图形大小
plt.figure(figsize=(20, 8), dpi=80)

# 使用scatter绘制散点图
plt.scatter(x_3, y_3, label="3月份")
plt.scatter(x_10, y_10, label="10月份")

# 调整X的刻度
_x = list(x_3) + list(x_10)
_xtick_lables = ["3月0日".format(i) for i in x_3]
_xtick_lables += ["10月0日".format(i) for i in x_10]
plt.xticks(_x[::3], _xtick_lables[::3], fontproperties=my_font, rotation=45)

# 添加图例
plt.legend(loc="upper left", prop=my_font)

# 添加标题
plt.xlabel("月份", fontproperties=my_font)
plt.ylabel("温度", fontproperties=my_font)
plt.title("3月份与10月份温度对比散点图", fontproperties=my_font)

# 展示
plt.show()

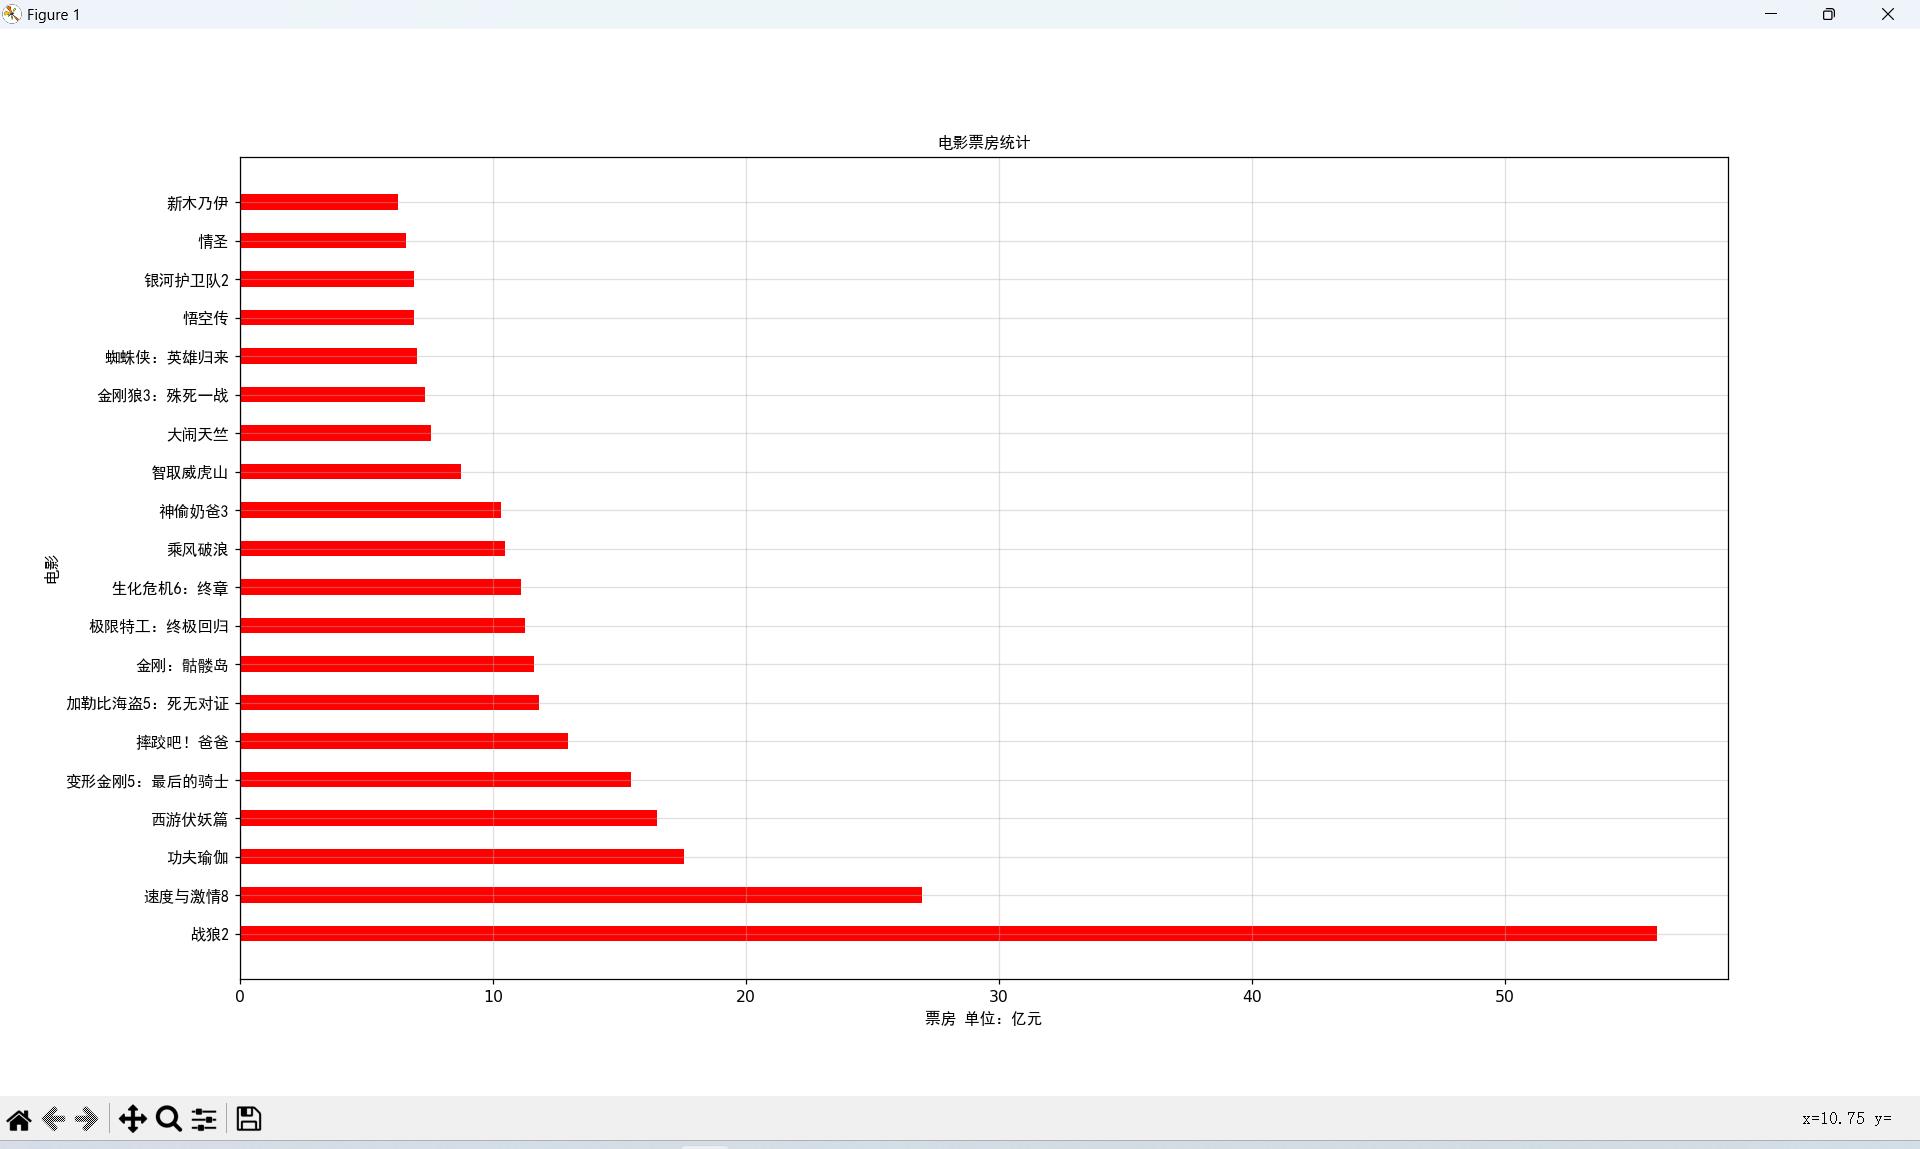
绘制条形图
# 绘制条形图

from matplotlib import pyplot as plt
from matplotlib import font_manager

# 设置字体
my_font = font_manager.FontProperties(fname="C:\\Windows\\Fonts\\simhei.ttf")

a = [
    "战狼2", "速度与激情8", "功夫瑜伽", "西游伏妖篇", "变形金刚5:最后的骑士", "摔跤吧!爸爸", "加勒比海盗5:死无对证", "金刚:骷髅岛", "极限特工:终极回归", "生化危机6:终章", "乘风破浪", "神偷奶爸3", "智取威虎山", "大闹天竺", "金刚狼3:殊死一战", "蜘蛛侠:英雄归来", "悟空传", "银河护卫队2", "情圣", "新木乃伊"
]

b = [
    56.01, 26.94, 17.53, 16.49, 15.45, 12.96, 11.8, 11.61, 11.28,
    11.12, 10.49, 10.3, 8.75, 7.55, 7.32, 6.99, 6.88, 6.86, 6.58, 6.23
]

# 调整图形大小
plt.figure(figsize=(16, 6), dpi=90)

# 绘制图形
# plt.bar是绘制树状条形图
plt.barh(range(len(a)), b, height=0.4, color="red")

# 设置Y轴刻度
plt.yticks(range(len(a)), a, fontproperties=my_font)

# 设置网格,para:alpha 透明度
plt.grid(alpha=0.4)


# 设置标签
plt.xlabel("票房 单位:亿元", fontproperties=my_font)
plt.ylabel("电影", fontproperties=my_font)
plt.title("电影票房统计", fontproperties=my_font)

# 展示
plt.show()

以上是关于Matplotlib绘制散点图与条形图的主要内容,如果未能解决你的问题,请参考以下文章