python matplotlib 中ax.legend()用法解释
Posted 小娜子成长记
tags:
篇首语:本文由小常识网(cha138.com)小编为大家整理,主要介绍了python matplotlib 中ax.legend()用法解释相关的知识,希望对你有一定的参考价值。
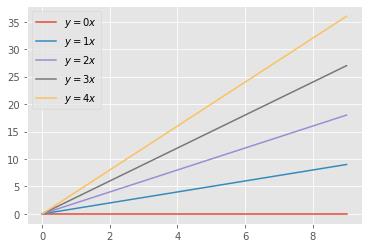
ax.legend()作用:在图上标明一个图例,用于说明每条曲线的文字显示
import matplotlib.pyplot as plt
import numpy as np

x = np.arange(10)

fig = plt.figure()
ax = plt.subplot(111)

for i in range(5):
    #ax.plot(x, i * x, label=\'y=%dx\' %i)
    ax.plot(x, i * x, label=\'$y = %ix$\' % i)

ax.legend()
plt.legend(loc=2)

plt.show()

legend()有一个loc参数,用于控制图例的位置。 比如 plot.legend(loc=2) , 这个位置就是4象项中的第二象项,也就是左上角。 loc可以为1,2,3,4 这四个数字。
如果把那句legend() 的语句去掉,那么图形上的图例也就会消失了。
http://30daydo.com/article/215
以上是关于python matplotlib 中ax.legend()用法解释的主要内容,如果未能解决你的问题,请参考以下文章