Python_Statistics&Probability
Posted tlfox_2006
tags:
篇首语:本文由小常识网(cha138.com)小编为大家整理,主要介绍了Python_Statistics&Probability相关的知识,希望对你有一定的参考价值。
python_statistics and probability
https://blog.csdn.net/howhigh/article/details/78007317
https://www.jb51.net/article/152713.htm
常见分布
https://www.jianshu.com/p/c675e3f67843
Python 统计学
https://zhuanlan.zhihu.com/c_178173216
python实现
https://blog.csdn.net/charie411/article/details/100032776
1. 常用的统计分布
用Python统计模拟的方法,介绍四种常用的统计分布,包括离散分布:二项分布和泊松分布,以及连续分布:指数分布和正态分布,最后查看人群的身高和体重数据所符合的分布。
首先导入python相关模块:
import pandas as pd
import numpy as np
import matplotlib.pyplot as plt
import seaborn as sns
%matplotlib inline
%config InlineBackend.figure_format = \'retina\'
随机数
计算机发明后,便产生了一种全新的解决问题的方式:使用计算机对现实世界进行统计模拟。该方法又称为“蒙特卡洛方法(Monte Carlo method)”,起源于二战时美国研制原子弹的曼哈顿计划,它的发明人中就有大名鼎鼎的冯·诺依曼。蒙特卡洛方法的名字来源也颇为有趣,相传另一位发明者乌拉姆的叔叔经常在摩洛哥的蒙特卡洛赌场输钱,赌博是一场概率的游戏,故而以概率为基础的统计模拟方法就以这一赌城命名了。
使用统计模拟,首先要产生随机数,在Python中,numpy.random 模块提供了丰富的随机数生成函数。比如生成0到1之间的任意随机数:
np.random.random(size=5) # size表示生成随机数的个数
结果:
array([0.12291039, 0.90953163, 0.19120842, 0.14675931, 0.94498984])
又比如生成一定范围内的随机整数:
np.random.randint(1, 10, size=5) # 生成5个1到9之间的随机整数
结果:
array([2, 8, 6, 4, 2])
产生常见分布的随机数:
1) 二项式或贝努力分布:
#np.random
np.random.binomial(10,0.5,size = 1000)

#scripy.stats
stats.binom.rvs(10,0.5,1000)
2) 指数分布
# np.random
np.random.exponential(10,size=1000)

# scipy.stats
stats.expon.rvs(10,size=1000)
3) 均匀分布
# np.random
np.random.uniform(-1,1,size=1000)

# scipy.ststs
stats.uniform.rvs(-1,1,size=1000)
4)正态分布
# np.random
np.random.normal(0,1,size=1000)

# scipy.stats
stats.uniform.rvs(-1,1,size=1000)
PMF&PDF
1) 二项式分布
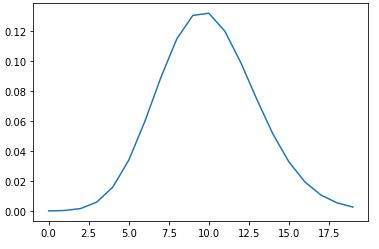
_lambda = 10.0                          # lambda恒等于10,二项分布的试验次数计算每次事件出现的概率p=lambda/n
k=np.arange(21)                         # 正面朝上次数
binom_100 = st.binom.pmf(k,100,_lambda/100)      # st.binom.pmf(k,n,p)
plt.plot(k,binom_100)
# np.binomial
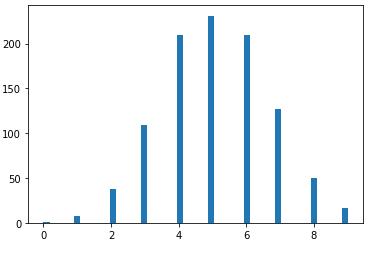
binom_np = np.random.binomial(10,0.5,size=1000)

# plot PMF histogram
plt.hist(binom_np,bins=50)
hist_np = np.histogram(binom_np)[0]
plt.plot(hist_np)

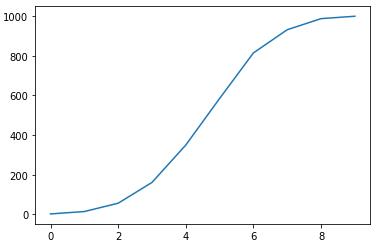
# plot CDF
cdf_np = np.cumsum(hist_np)
plt.plot(cdf_np)

# st.binom
binom_st = st.binom.rvs(10,0.5,size=1000)

# plot histogram
plt.hist(binom_st,bins=50)
hist_st = np.histogram(binom_st)[0]
plt.plot(hist_st)

# plot CDF
cdf_st = np.cumsum(hist_st)
plt.plot(cdf_st)
2)泊松分布
#泊松分布:在某段时间范围内,事件发生的次数。
_lambda = 10.0                # 事件平均发生率lambda恒等于10
k = np.arange(20)             # 事件发生的次数。
psn = st.poisson.pmf(k,_lambda)    # st.poisson.pmf(k,Lambda)
plt.plot(k,psn)
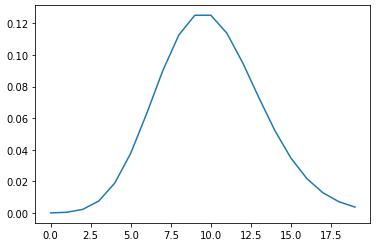
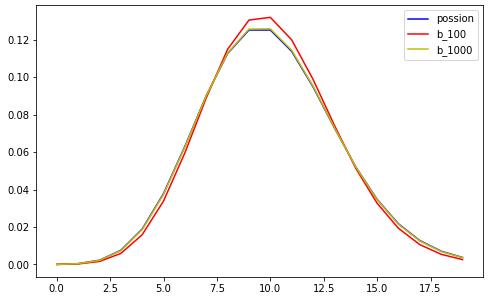
泊松分布与二项分布的关系:当n很大,而p很小时,二项分布可以近似于泊松分布。
3)均匀分布
4)指数分布
5)正态分布
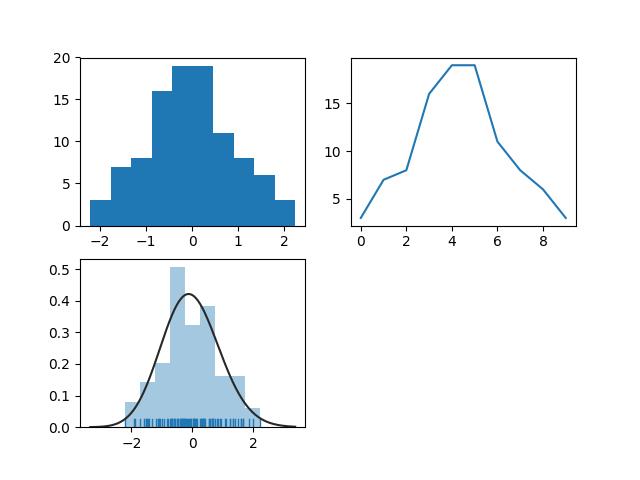
下面介绍使用python生成pdf的方法:
- 使用matplotlib的画图接口plot.hist(),直接画出pdf分布;
- 使用numpy的数据处理函数histogram(),可以生成pdf分布数据,方便进行后续的数据处理,比如进一步生成cdf;
- 使用seaborn的distplot(),好处是可以进行pdf分布的拟合,查看自己数据的分布类型;
 Plot PDF

arr = np.random.normal(size=100)

# plot histogram
plt.subplot(221)
plt.hist(arr)

# obtain histogram data
plt.subplot(222)
hist, bin_edges = np.histogram(arr)
plt.plot(hist)

# fit histogram curve
plt.subplot(223)
sns.distplot(arr, kde=False, fit=stats.gamma, rug=True)
plt.show()
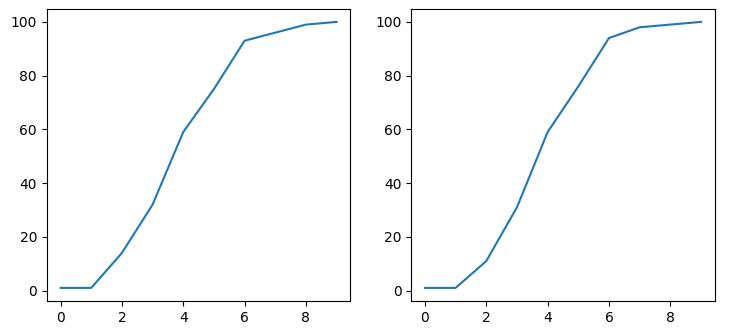
下面介绍使用python生成cdf的方法:
- 使用numpy的数据处理函数histogram(),生成pdf分布数据,进一步生成cdf;
- 使用seaborn的cumfreq(),直接画出cdf;

from scipy import stats
import matplotlib.pyplot as plt
import numpy as np
import seaborn as sns

arr = np.random.normal(size=100)

plt.subplot(121)
hist, bin_edges = np.histogram(arr)
cdf = np.cumsum(hist)
plt.plot(cdf)

plt.subplot(122)
cdf = stats.cumfreq(arr)
plt.plot(cdf[0])

plt.show()
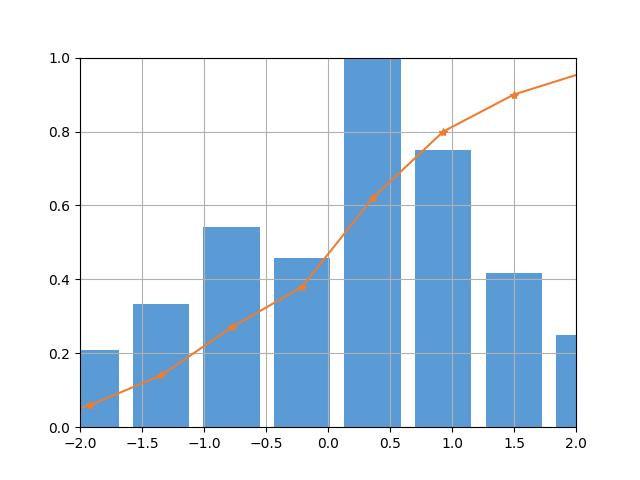
在更多时候,需要把pdf和cdf放在一起,可以更好的显示数据分布。

from scipy import stats
import matplotlib.pyplot as plt
import numpy as np
import seaborn as sns

arr = np.random.normal(size=100)

hist, bin_edges = np.histogram(arr)
width = (bin_edges[1] - bin_edges[0]) * 0.8
plt.bar(bin_edges[1:], hist/max(hist), width=width, color=\'#5B9BD5\')

cdf = np.cumsum(hist/sum(hist))
plt.plot(bin_edges[1:], cdf, \'-*\', color=\'#ED7D31\')

plt.xlim([-2, 2])
plt.ylim([0, 1])
plt.grid()

plt.show()
1) 二项分布
二项分布(伯努利分布)是n个独立的是/非试验中成功的次数的概率分布,其中每次试验的成功概率为p。这是一个离散分布,所以使用概率质量函数(PMF)来表示k次成功的概率:

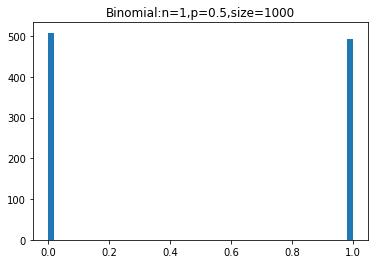
最常见的二项分布就是投硬币问题了,每次投一个硬币,投n次硬币,正面朝上次数就满足该分布。size(投掷次数)可以从10~10000. 看图形的变化。
sample=np.random.binomial(1,0.5,size=100)
plt.hist(sample,bins=50)
下面我们使用计算机模 拟的方法,产生10000个符合(n,p)的二项分布随机数,相当于进行10000次实验,每次实验投掷了n(10)枚硬币,正面朝上的硬币数就是所产生的随机数。同时使用直方图函数绘制出二项分布的PMF图。

def plot_binomial_PDF(n,p,size):
    \'\'\'绘制二项分布的概率质量函数\'\'\'
    sample = np.random.binomial(n,p,size)  # 产生10000个符合二项分布的随机数
    bins = np.arange(n+2)
    plt.hist(sample, bins=bins, align=\'left\', normed=True, rwidth=0.1)  # 绘制直方图
    #设置标题和坐标
    plt.title(\'Binomial PMF with n={}, p={}\'.format(n,p))
    plt.xlabel(\'number of successes\')
    plt.ylabel(\'probability\')
def plot_binomial_CDF(n,p,size):
    sample=np.random.binomial(n,p,size)
    hist,bin_edges=np.histogram(sample)
    cdf=np.cumsum(hist/sum(hist))        #必须除以sum(hist),才可以归一化。
    plt.plot(cdf)
plot_binomial_PDF(10, 0.5, 10000)
plot_binomial_CDF(10, 0.5, 10000)
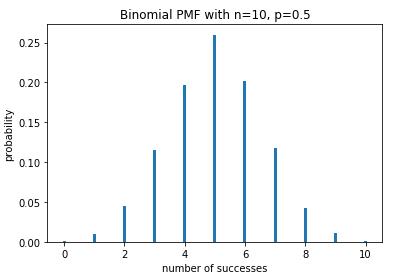
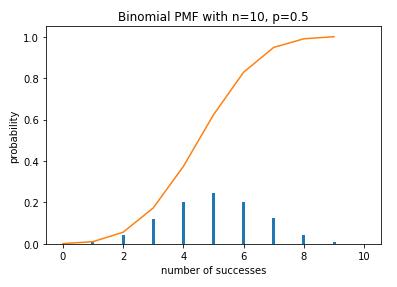
投10枚硬币,如果正面或反面朝上的概率相同,即p=0.5, 那么出现正面次数的分布符合上图所示的二项分布。该分布左右对称,最有可能的情况是正面出现5次。
但如果这是一枚作假的硬币呢?比如正面朝上的概率p=0.2,或者是p=0.8,又会怎样呢?我们依然可以做出该情况下的PMF图。
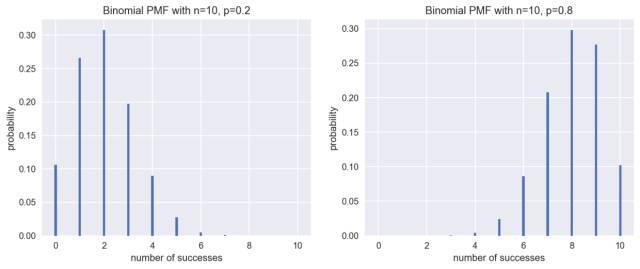
这时的分布不再对称了,正如我们所料,当概率p=0.2时,正面最有可能出现2次;而当p=0.8时,正面最有可能出现8次。
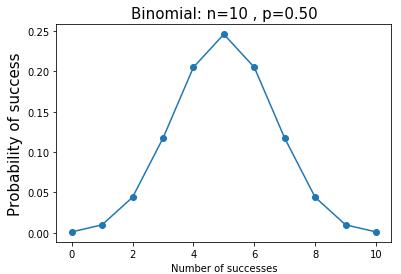
二项分布的例子:抛掷10次硬币,恰好两次正面朝上的概率是多少? - -> k=2, n = 10, p=0.5

def binom_pmf():
     n = 10           #独立实验次数
     p = 0.5           #每次正面朝上概率
     k = np.arange(0,11)   #0-10次正面朝上概率
     binomial = stats.binom.pmf(k,n,p)
     print(binomial)
     print(sum(binomial))
     print(binomial[2])
     plt.plot(k, binomial,\'o-\')
     plt.title(\'Binomial: n=%i , p=%.2f\' % (n,p),fontsize=15)
     plt.xlabel(\'Number of successes\')
     plt.ylabel(\'Probability of success\',fontsize=15)
     plt.show()

[0.00097656 0.00976563 0.04394531 0.1171875  0.20507813 0.24609375
 0.20507813 0.1171875  0.04394531 0.00976563 0.00097656]
1.0000000000000009
0.04394531249999999
2) 泊松分布
泊松分布用于描述单位时间内随机事件发生次数的概率分布,它也是离散分布,其概率质量函数PMF为:

比如你在等公交车,假设这些公交车的到来是独立且随机的(当然这不是现实),前后车之间没有关系,那么在1小时中到来的公交车数量就符合泊松分布。同样使用统计模拟的方法绘制该泊松分布,这里假设每小时平均来6辆车(即上述公式中lambda=6)。

lamb = 6
sample = np.random.poisson(lamb, size=10000)  # 生成10000个符合泊松分布的随机数
bins = np.arange(20)
plt.hist(sample, bins=bins, align=\'left\', rwidth=0.1, normed=True) # 绘制直方图# 设置标题和坐标轴
plt.title(\'Poisson PMF (lambda=6)\')
plt.xlabel(\'number of arrivals\')
plt.ylabel(\'probability\')
plt.show()
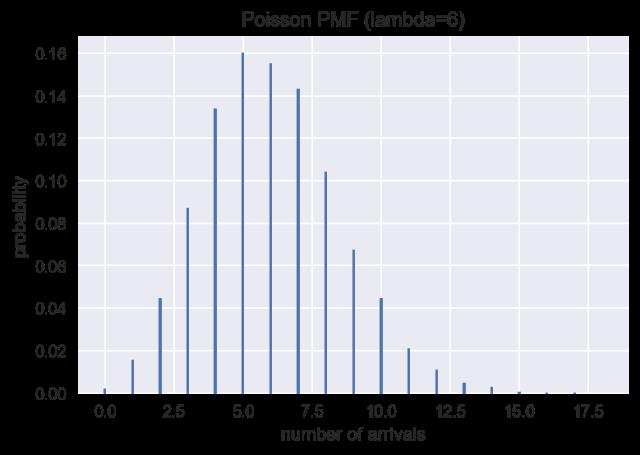
根据图示,你会发现,泊松分布像正态分布,且λ=6的数据比较多。

from scipy import stats
import matplotlib.pyplot as plt
import numpy as np
import seaborn as sns

arr = np.random.POISSON(5,size=100)

hist, bin_edges = np.histogram(arr)
width = (bin_edges[1] - bin_edges[0]) * 0.8
plt.bar(bin_edges[1:], hist/max(hist), width=width, color=\'#5B9BD5\')

cdf = np.cumsum(hist/sum(hist))
plt.plot(bin_edges[1:], cdf, \'-*\', color=\'#ED7D31\')

plt.title("Poisson PMF&CDF")
plt.xlabel("number of arrives")
plt.ylabel("probability")
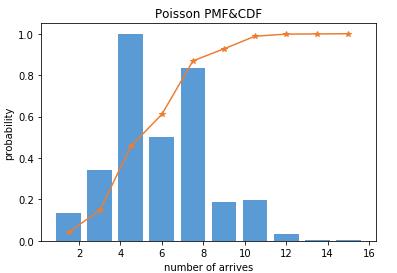
二项分布的近似分布泊松分布
程序分别计算二项分布和泊松分布的概率质量函数,当n足够大时,二者是十分接近的。
程序中事件平均发生率lambda恒等于10。根据二项分布的试验次数计算每次事件出现的概率p=lambda/n。lambda = np

_lambda = 10.0
k = np.arange(20)
possion = stats .poisson .pmf(k, _lambda) # 泊松分布
binom100 = stats.binom.pmf(k, 100, _lambda/100) #二项式分布 100
binom1000=stats.binom.pmf(k, 1000 , _lambda/1000) #二项式分布 1000

plt.figure(num=3,figsize=(8,5))
plt.plot(stats .poisson .pmf(k, _lambda),\'b\')
plt.plot(stats.binom.pmf(k,100,_lambda/100),\'r\')
plt.plot(stats.binom.pmf(k,1000,_lambda/1000),\'y\')
plt.legend([\'possion\',\'binom_100\',\'binom_1000\'])
3)均匀分布

from scipy import stats
import matplotlib.pyplot as plt
import numpy as np

arr = np.random.uniform(-2,2,1000)

hist, bin_edges = np.histogram(arr)
width = (bin_edges[1] - bin_edges[0]) * 0.8
plt.bar(bin_edges[1:], hist/max(hist), width=width, color=\'#5B9BD5\')

cdf = np.cumsum(hist/sum(hist))
plt.plot(bin_edges[1:], cdf, \'-*\', color=\'#ED7D31\')
plt.title("Uniform PMF&CDF")
plt.xlabel("number of arrives")
plt.ylabel("probability")

plt.xlim([-2,2])
plt.ylim([0,1])
4) 指数分布
指数分布用以描述独立随机事件发生的时间间隔,这是一个连续分布,所以用质量密度函数表示:

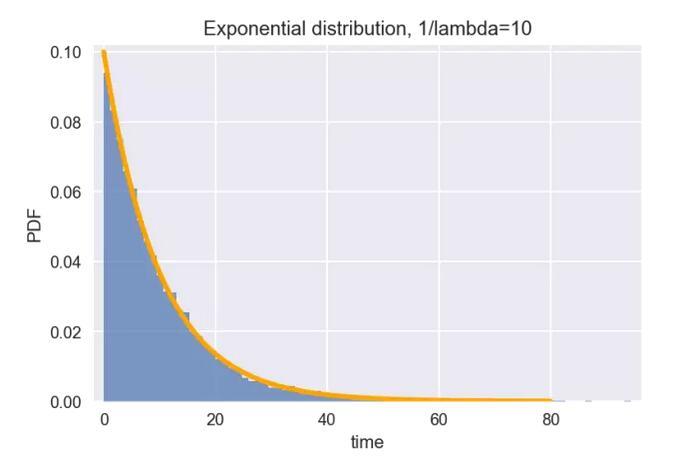
比如上面等公交车的例子,两辆车到来的时间间隔,就符合指数分布。假设平均间隔为10分钟(即1/lambda=10),那么从上次发车开始,你等车的时间就满足下图所示的指数分布。
tau = 10
sample = np.random.exponential(tau, size=10000)  # 产生10000个满足指数分布的随机数
plt.hist(sample, bins=80, alpha=0.7, normed=True) #绘制直方图
plt.margins(0.02)

# 根据公式绘制指数分布的概率密度函数
lam = 1 / tau
x = np.arange(0,80,0.1)
y = lam * np.exp(- lam * x)
plt.plot(x,y,color=\'orange\', lw=3)#设置标题和坐标轴
plt.title(\'Exponential distribution, 1/lambda=10\')
plt.xlabel(\'time\')
plt.ylabel(\'PDF\')
plt.show()
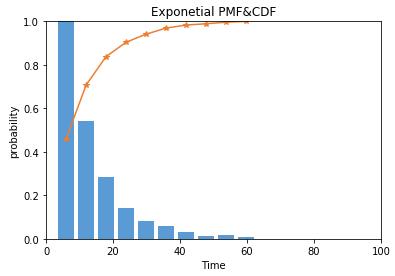
Exponential PDF&CDF:

from scipy import stats
import matplotlib.pyplot as plt
import numpy as np

arr = np.random.exponential(10,1000)

#PDF
hist, bin_edges = np.histogram(arr)
width = (bin_edges[1] - bin_edges[0]) * 0.8
plt.bar(bin_edges[1:], hist/max(hist), width=width, color=\'#5B9BD5\')

#CDF
cdf = np.cumsum(hist/sum(hist))
plt.plot(bin_edges[1:], cdf, \'-*\', color=\'#ED7D31\')

plt.title("Exponetial PMF&CDF")
plt.xlabel("Time")
plt.ylabel("probability")
plt.xlim([0,100])
plt.ylim([0,1])
5) 正态分布
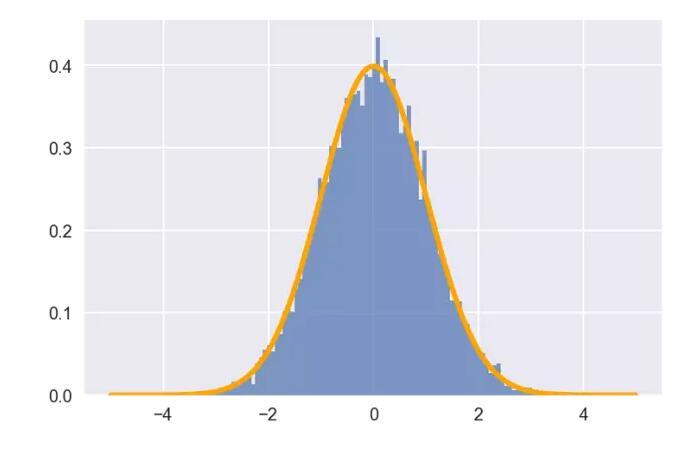
正态分布是一种很常用的统计分布,可以描述现实世界的诸多事物,具备非常漂亮的性质,其概率密度函数为

以下绘制了均值为0,标准差为1的正态分布的概率密度曲线,其形状好似一口倒扣的钟,因此也称钟形曲线
def norm_pdf(x,mu,sigma):
    \'\'\'正态分布概率密度函数\'\'\'
    pdf = np.exp(-((x - mu)**2) / (2* sigma**2)) / (sigma * np.sqrt(2*np.pi))    return pdf

mu = 0    # 均值为0
sigma = 1 # 标准差为1
# 用统计模拟绘制正态分布的直方图
sample = np.random.normal(mu, sigma, size=10000)
plt. hist(sample, bins=100, alpha=0.7, normed=True)# 根据正态分布的公式绘制PDF曲线
x = np.arange(-5, 5, 0.01)
y = norm_pdf(x, mu, sigma)
plt.plot(x,y, color=\'orange\', lw=3)
plt.show()
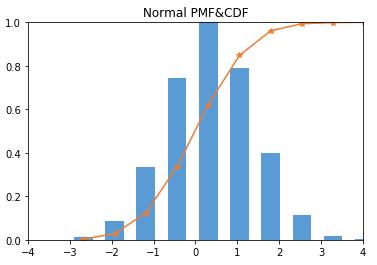
Normal PDF&CDF

from scipy import stats
import matplotlib.pyplot as plt
import numpy as np

arr = np.random.normal(0,1,10000)

#PDF
hist, bin_edges = np.histogram(arr)
width = (bin_edges[1] - bin_edges[0]) * 0.6
plt.bar(bin_edges[1:], hist/max(hist), width=width, color=\'#5B9BD5\')

#CDF
cdf = np.cumsum(hist/sum(hist))
plt.plot(bin_edges[1:], cdf, \'-*\', color=\'#ED7D31\')

plt.title("Normal PMF&CDF")
plt.xlim([-4,4])
plt.ylim([0,1])
假设检验,亦称显著性检验,是利用样本信息,根据一定的概率水准,推断指标(统计量)与总体指标(参数)、不同样本指标间的差别有无意义的统计分析方法。
参数检验:是依赖总体分布的具体形式的统计方法,简称参数法。常用的参数法有X2检验、t检验、F检验等。使用条件是抽样总体的分布已知。
- 优点:能充分利用样本信息;检验效率高
- 缺点:应用条件限制较多;手工计算较繁琐。
非参数检验:是一类不依赖总体分布的具体形式的统计方法。如Ridit分析、秩和检验、符号检验、中位数检验、序贯试验、等级相关分析等。
- 优点:对总体的分布形式不要求;可用于不能精确测量的资料;易于理解和掌握;计算简便。
- 缺点:不能充分利用资料所提供的信息,是检验效率降低。
卡方分布
https://www.cnblogs.com/Yuanjing-Liu/p/9252844.html
https://zhuanlan.zhihu.com/p/36351919
理论:
https://wenku.baidu.com/view/3931858f53ea551810a6f524ccbff121dd36c5e0.html
公式:ΣX2,多个正态分布的平方和,其自由度是n-1个正态分布平方相加。
应用:分类的关联性,即是否独立
卡方分布python实现:
https://blog.csdn.net/charie411/article/details/99962293
T分布
理论:
https://wenku.baidu.com/view/1ea79dfddd88d0d233d46ab3.html
https://wenku.baidu.com/view/0dac87170b4e767f5acfcee6.html?sxts=1566439275597
基本思想:样本均值与与已知的总体均值比较。
T检验python实现:
https://blog.csdn.net/charie411/article/details/100009024
https://mp.weixin.qq.com/s/sv5QipNA6QPWgDC3R8DuAQ
T检验的应用:
单样本T检验:用于样本均数与已知总体均数的比较。此时,总体均数认为是已知的。
配对样本T检验:配对设计:是将观察单位按照某些特征(如性别、年龄、病情等可疑混杂因素)配成条件相同或相似的对子,每对中的两个观察单位随机分配到两个组,给与不同的处理,观察指标的变化
以上是关于Python_Statistics&Probability的主要内容,如果未能解决你的问题,请参考以下文章
