人工智能创新挑战赛:海洋气象预测Baseline[4]完整版(TensorFlowtorch版本)含数据转化模型构建MLPTCNN+RNNLSTM模型训练以及预测
Posted ✨汀、
tags:
篇首语:本文由小常识网(cha138.com)小编为大家整理,主要介绍了人工智能创新挑战赛:海洋气象预测Baseline[4]完整版(TensorFlowtorch版本)含数据转化模型构建MLPTCNN+RNNLSTM模型训练以及预测相关的知识,希望对你有一定的参考价值。
人工智能创新挑战赛:海洋气象预测Baseline[4]完整版(TensorFlow、torch版本)含数据转化、模型构建、MLP、TCNN+RNN、LSTM模型训练以及预测
1.赛题简介
项目链接以及码源见文末
2021 “AI Earth” 人工智能创新挑战赛,以 “AI 助力精准气象和海洋预测” 为主题,旨在探索人工智能技术在气象和海洋领域的应用。
本赛题的背景是厄尔尼诺 - 南方涛动(ENSO)现象。ENSO现象是厄尔尼诺(EN)现象和南方涛动(SO)现象的合称,其中厄尔尼诺现象是指赤道中东太平洋附近的海表面温度持续异常增暖的现象,南方涛动现象是指热带东太平洋与热带西太平洋气压场存在的气压变化相反的跷跷板现象。厄尔尼诺现象和南方涛动现象实际是反常气候分别在海洋和大气中的表现,二者密切相关,因此合称为厄尔尼诺 - 南方涛动现象。
ENSO现象会在世界大部分地区引起极端天气,对全球的天气、气候以及粮食产量具有重要的影响,准确预测ENSO,是提高东亚和全球气候预测水平和防灾减灾的关键。Nino3.4指数是ENSO现象监测的一个重要指标,它是指Nino3.4区(170°W - 120°W,5°S - 5°N)的平均海温距平指数,用于反应海表温度异常,若Nino3.4指数连续5个月超过0.5℃就判定为一次ENSO事件。本赛题的目标,就是基于历史气候观测和模式模拟数据,利用T时刻过去12个月(包含T时刻)的时空序列,预测未来1 - 24个月的Nino3.4指数。


基于以上信息可以看出,我们本期的组队学习要完成的是一个时空序列的预测任务。
竞赛题目
数据简介
本赛题使用的训练数据包括CMIP5中17个模式提供的140年的历史模拟数据、CMIP6中15个模式提供的151年的历史模拟数据和美国SODA模式重建的100年的历史观测同化数据,采用nc格式保存,其中CMIP5和CMIP6分别是世界气候研究计划(WCRP)的第5次和第6次耦合模式比较计划,这二者都提供了多种不同的气候模式对于多种气候变量的模拟数据。这些数据包含四种气候变量:海表温度异常(SST)、热含量异常(T300)、纬向风异常(Ua)、经向风异常(Va),数据维度为(year, month, lat, lon),对于训练数据提供对应月份的Nino3.4指数标签数据。简而言之,提供的训练数据中的每个样本为某年、某月、某个维度、某个经度的SST、T300、Ua、Va数值,标签为对应年、对应月的Nino3.4指数。
需要注意的是,样本的第二维度month的长度不是12个月,而是36个月,对应从当前year开始连续三年的数据,例如SODA训练数据中year为0时包含的是从第1 - 第3年逐月的历史观测数据,year为1时包含的是从第2年 - 第4年逐月的历史观测数据,也就是说,样本在时间上是有交叉的。

另外一点需要注意的是,Nino3.4指数是Nino3.4区域从当前月开始连续三个月的SST平均值,也就是说,我们也可以不直接预测Nino3.4指数,而是以SST为预测目标,间接求得Nino3.4指数。
测试数据为国际多个海洋资料同化结果提供的随机抽取的$N$段长度为12个月的时间序列,数据采用npy格式保存,维度为(12, lat, lon, 4),第一维度为连续的12个月份,第四维度为4个气候变量,按SST、T300、Ua、Va的顺序存放。测试集文件序列的命名如test_00001_01_12.npy中00001表示编号,01表示起始月份,12表示终止月份。
训练数据说明
每个数据样本第一维度(year)表征数据所对应起始年份,对于CMIP数据共4645年,其中1-2265为CMIP6中15个模式提供的151年的历史模拟数据(总共:151年 *15 个模式=2265);2266-4645为CMIP5中17个模式提供的140年的历史模拟数据(总共:140年 *17 个模式=2380)。对于历史观测同化数据为美国提供的SODA数据。
其中每个样本第二维度(mouth)表征数据对应的月份,对于训练数据均为36,对应的从当前年份开始连续三年数据(从1月开始,共36月),比如:
SODA_train.nc中[0,0:36,:,:]为第1-第3年逐月的历史观测数据;
SODA_train.nc中[1,0:36,:,:]为第2-第4年逐月的历史观测数据;
…,
SODA_train.nc中[99,0:36,:,:]为第100-102年逐月的历史观测数据。
和
CMIP_train.nc中[0,0:36,:,:]为CMIP6第一个模式提供的第1-第3年逐月的历史模拟数据;
…,
CMIP_train.nc中[150,0:36,:,:]为CMIP6第一个模式提供的第151-第153年逐月的历史模拟数据;
CMIP_train.nc中[151,0:36,:,:]为CMIP6第二个模式提供的第1-第3年逐月的历史模拟数据;
…,
CMIP_train.nc中[2265,0:36,:,:]为CMIP5第一个模式提供的第1-第3年逐月的历史模拟数据;
…,
CMIP_train.nc中[2405,0:36,:,:]为CMIP5第二个模式提供的第1-第3年逐月的历史模拟数据;
…,
CMIP_train.nc中[4644,0:36,:,:]为CMIP5第17个模式提供的第140-第142年逐月的历史模拟数据。
其中每个样本第三、第四维度分别代表经纬度(南纬55度北纬60度,东经0360度),所有数据的经纬度范围相同。
训练数据标签说明
标签数据为Nino3.4 SST异常指数,数据维度为(year,month)。
CMIP(SODA)_train.nc对应的标签数据当前时刻Nino3.4 SST异常指数的三个月滑动平均值,因此数据维度与维度介绍同训练数据一致
注:三个月滑动平均值为当前月与未来两个月的平均值。
测试数据说明
测试用的初始场(输入)数据为国际多个海洋资料同化结果提供的随机抽取的n段12个时间序列,数据格式采用NPY格式保存,维度为(12,lat,lon, 4),12为t时刻及过去11个时刻,4为预测因子,并按照SST,T300,Ua,Va的顺序存放。
测试集文件序列的命名规则:test_编号_起始月份_终止月份.npy,如test_00001_01_12_.npy。
评估指标
本赛题的评估指标如下:
$$
Score = \\frac23 \\times accskill - RMSE
$$
其中$accskill$为相关性技巧评分,计算方式如下:
$$
accskill = \\sum_i=1^24 a \\times ln(i) \\times cor_i \\
(i \\leq 4, a = 1.5; 5 \\leq i \\leq 11, a = 2; 12 \\leq i \\leq 18, a = 3; 19 \\leq i, a = 4)
$$
可以看出,月份$i$增加时系数$a$也增大,也就是说,模型能准确预测的时间越长,评分就越高。
$cor_i$是对于$N$个测试集样本在时刻$i$的预测值与实际值的相关系数,计算公式如下:
$$
cor_i = \\frac\\sum_j=1N(y_truej-\\bary_true)(y_predj-\\bary_pred)\\sqrt\\sum(y_truej-\\bary_true)2\\sum(y_predj-\\barypred)^2
$$
其中$y$为时刻$i$样本$j$的实际Nino3.4指数,$\\barytrue$为该时刻$N$个测试集样本的Nino3.4指数的均值,$y$为时刻$i$样本$j$的预测Nino3.4指数,$\\bary_pred$为该时刻$N$个测试集样本的预测Nino3.4指数的均值。
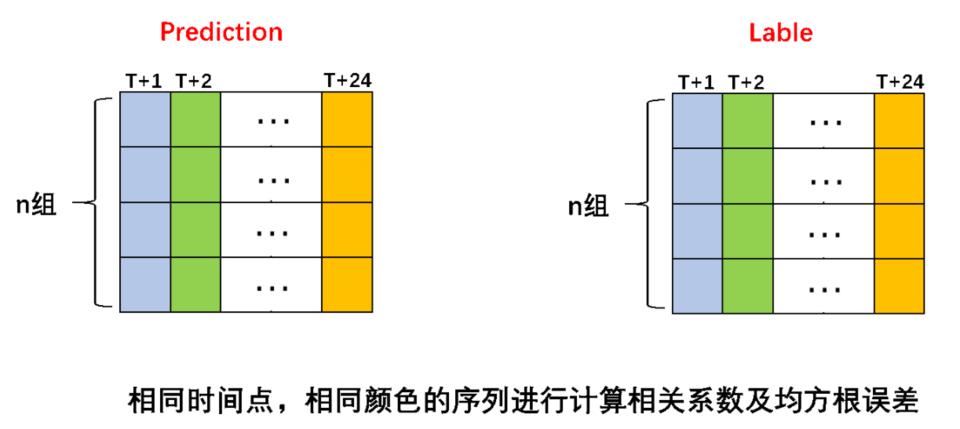
$RMSE$为24个月份的累计均方根误差,计算公式为:
$$
RMSE = \\sum_i=1^24rmse_i \\
rmse = \\sqrt\\frac1N\\sum_j=1N(y_truej-y_predj)2
$$
赛题分析
分析上述赛题信息可以发现,我们需要解决的是以下问题:
- 对于一个时空序列预测问题,要如何挖掘时间信息?如何挖掘空间信息?
- 数据中给出的特征是四个气象领域公认的、通用的气候变量,我们很难再由此构造新的特征。如果不构造新的特征,要如何从给出的特征中挖掘出更多的信息?
- 训练集的数据量不大,总共只有$140\\times17+151\\times15+100=4745$个训练样本,对于数据量小的预测问题,我们通常需要从以下两方面考虑:
- 如何增加数据量?
- 如何构造小(参数量小,减小过拟合风险)而深(能提取出足够丰富的信息)的模型?
2.线下数据转换
- 将数据转化为我们所熟悉的形式,每个人的风格不一样,此处可以作为如何将nc文件转化为csv等文件
数据转化
## 工具包导入&数据读取
### 工具包导入

\'\'\'
安装工具
# !pip install netCDF4
\'\'\'
import pandas as pd
import numpy  as np
import tensorflow as tf
from tensorflow.keras.optimizers import Adam
import matplotlib.pyplot as plt
import scipy
from netCDF4 import Dataset
import netCDF4 as nc
import gc
%matplotlib inline
数据读取
SODA_label处理
- 标签含义
标签数据为Nino3.4 SST异常指数,数据维度为(year,month)。
CMIP(SODA)_train.nc对应的标签数据当前时刻Nino3.4 SST异常指数的三个月滑动平均值,因此数据维度与维度介绍同训练数据一致
注:三个月滑动平均值为当前月与未来两个月的平均值。
- 将标签转化为我们熟悉的pandas形式
label_path       = \'./data/SODA_label.nc\'
label_trans_path = \'./data/\'
nc_label         = Dataset(label_path,\'r\')

years            = np.array(nc_label[\'year\'][:])
months           = np.array(nc_label[\'month\'][:])

year_month_index = []
vs               = []
for i,year in enumerate(years):
    for j,month in enumerate(months):
        year_month_index.append(\'year__month_\'.format(year,month))
        vs.append(np.array(nc_label[\'nino\'][i,j]))

df_SODA_label               = pd.DataFrame(\'year_month\':year_month_index)
df_SODA_label[\'year_month\'] = year_month_index
df_SODA_label[\'label\']      = vs

df_SODA_label.to_csv(label_trans_path + \'df_SODA_label.csv\',index = None)
df_SODA_label.head()
| year_month | label | |
|---|---|---|
| 0 | year_1_month_1 | -0.40720701217651367 |
| 1 | year_1_month_2 | -0.20244435966014862 |
| 2 | year_1_month_3 | -0.10386104136705399 |
| 3 | year_1_month_4 | -0.02910841442644596 |
| 4 | year_1_month_5 | -0.13252995908260345 |
转化
SODA_train处理
SODA_train.nc中[0,0:36,:,:]为第1-第3年逐月的历史观测数据;

SODA_train.nc中[1,0:36,:,:]为第2-第4年逐月的历史观测数据;
…,
SODA_train.nc中[99,0:36,:,:]为第100-102年逐月的历史观测数据。
SODA_path        = \'./data/SODA_train.nc\'
nc_SODA          = Dataset(SODA_path,\'r\')
- 自定义抽取对应数据&转化为df的形式;
index为年月; columns为lat和lon的组合
def trans_df(df, vals, lats, lons, years, months):
    \'\'\'
        (100, 36, 24, 72) -- year, month,lat,lon
    \'\'\'
    for j,lat_ in enumerate(lats):
        for i,lon_ in enumerate(lons):
            c = \'lat_lon__\'.format(int(lat_),int(lon_))
            v = []
            for y in range(len(years)):
                for m in range(len(months)):
                    v.append(vals[y,m,j,i])
            df[c] = v
    return df
year_month_index = []

years              = np.array(nc_SODA[\'year\'][:])
months             = np.array(nc_SODA[\'month\'][:])
lats             = np.array(nc_SODA[\'lat\'][:])
lons             = np.array(nc_SODA[\'lon\'][:])


for year in years:
    for month in months:
        year_month_index.append(\'year__month_\'.format(year,month))

df_sst  = pd.DataFrame(\'year_month\':year_month_index)
df_t300 = pd.DataFrame(\'year_month\':year_month_index)
df_ua   = pd.DataFrame(\'year_month\':year_month_index)
df_va   = pd.DataFrame(\'year_month\':year_month_index)
%%time
df_sst = trans_df(df = df_sst, vals = np.array(nc_SODA[\'sst\'][:]), lats = lats, lons = lons, years = years, months = months)
df_t300 = trans_df(df = df_t300, vals = np.array(nc_SODA[\'t300\'][:]), lats = lats, lons = lons, years = years, months = months)
df_ua   = trans_df(df = df_ua, vals = np.array(nc_SODA[\'ua\'][:]), lats = lats, lons = lons, years = years, months = months)
df_va   = trans_df(df = df_va, vals = np.array(nc_SODA[\'va\'][:]), lats = lats, lons = lons, years = years, months = months)
label_trans_path = \'./data/\'
df_sst.to_csv(label_trans_path  + \'df_sst_SODA.csv\',index = None)
df_t300.to_csv(label_trans_path + \'df_t300_SODA.csv\',index = None)
df_ua.to_csv(label_trans_path   + \'df_ua_SODA.csv\',index = None)
df_va.to_csv(label_trans_path   + \'df_va_SODA.csv\',index = None)
CMIP_label处理
label_path       = \'./data/CMIP_label.nc\'
label_trans_path = \'./data/\'
nc_label         = Dataset(label_path,\'r\')

years            = np.array(nc_label[\'year\'][:])
months           = np.array(nc_label[\'month\'][:])

year_month_index = []
vs               = []
for i,year in enumerate(years):
    for j,month in enumerate(months):
        year_month_index.append(\'year__month_\'.format(year,month))
        vs.append(np.array(nc_label[\'nino\'][i,j]))

df_CMIP_label               = pd.DataFrame(\'year_month\':year_month_index)
df_CMIP_label[\'year_month\'] = year_month_index
df_CMIP_label[\'label\']      = vs

df_CMIP_label.to_csv(label_trans_path + \'df_CMIP_label.csv\',index = None)
df_CMIP_label.head()
| year_month | label | |
|---|---|---|
| 0 | year_1_month_1 | -0.26102548837661743 |
| 1 | year_1_month_2 | -0.1332537680864334 |
| 2 | year_1_month_3 | -0.014831557869911194 |
| 3 | year_1_month_4 | 0.10506672412157059 |
| 4 | year_1_month_5 | 0.24070978164672852 |
CMIP_train处理
CMIP_train.nc中[0,0:36,:,:]为CMIP6第一个模式提供的第1-第3年逐月的历史模拟数据;
…,
CMIP_train.nc中[150,0:36,:,:]为CMIP6第一个模式提供的第151-第153年逐月的历史模拟数据;

CMIP_train.nc中[151,0:36,:,:]为CMIP6第二个模式提供的第1-第3年逐月的历史模拟数据;
…,
CMIP_train.nc中[2265,0:36,:,:]为CMIP5第一个模式提供的第1-第3年逐月的历史模拟数据;
…,
CMIP_train.nc中[2405,0:36,:,:]为CMIP5第二个模式提供的第1-第3年逐月的历史模拟数据;
…,
CMIP_train.nc中[4644,0:36,:,:]为CMIP5第17个模式提供的第140-第142年逐月的历史模拟数据。

其中每个样本第三、第四维度分别代表经纬度(南纬55度北纬60度,东经0360度),所有数据的经纬度范围相同。
CMIP_path       = \'./data/CMIP_train.nc\'
CMIP_trans_path = \'./data\'
nc_CMIP  = Dataset(CMIP_path,\'r\')
nc_CMIP.variables.keys()
dict_keys([\'sst\', \'t300\', \'ua\', \'va\', \'year\', \'month\', \'lat\', \'lon\'])
nc_CMIP[\'t300\'][:].shape
(4645, 36, 24, 72)
year_month_index = []

years              = np.array(nc_CMIP[\'year\'][:])
months             = np.array(nc_CMIP[\'month\'][:])
lats               = np.array(nc_CMIP[\'lat\'][:])
lons               = np.array(nc_CMIP[\'lon\'][:])

last_thre_years = 1000
for year in years:
    \'\'\'
        数据的原因,我们
    \'\'\'
    if year >= 4645 - last_thre_years:
        for month in months:
            year_month_index.append(\'year__month_\'.format(year,month))

df_CMIP_sst  = pd.DataFrame(\'year_month\':year_month_index)
df_CMIP_t300 = pd.DataFrame(\'year_month\':year_month_index)
df_CMIP_ua   = pd.DataFrame(\'year_month\':year_month_index)
df_CMIP_va   = pd.DataFrame(\'year_month\':year_month_index)
- 因为内存限制,我们暂时取最后1000个year的数据
def trans_thre_df(df, vals, lats, lons, years, months, last_thre_years = 1000):
    \'\'\'
        (4645, 36, 24, 72) -- year, month,lat,lon
    \'\'\'
    for j,lat_ in (enumerate(lats)):
#         print(j)
        for i,lon_ in enumerate(lons):
            c = \'lat_lon__\'.format(int(lat_),int(lon_))
            v = []
            for y_,y in enumerate(years):
                \'\'\'
                    数据的原因,我们
                \'\'\'
                if y >= 4645 - last_thre_years:
                    for m_,m in  enumerate(months):
                        v.append(vals[y_,m_,j,i])
            df[c] = v
    return df
%%time
df_CMIP_sst  = trans_thre_df(df = df_CMIP_sst,  vals   = np.array(nc_CMIP[\'sst\'][:]),  lats = lats, lons = lons, years = years, months = months)
df_CMIP_sst.to_csv(CMIP_trans_path + \'df_CMIP_sst.csv\',index = None)
del df_CMIP_sst
gc.collect()

df_CMIP_t300 = trans_thre_df(df = df_CMIP_t300, vals   = np.array(nc_CMIP[\'t300\'][:]), lats = lats, lons = lons, years = years, months = months)
df_CMIP_t300.to_csv(CMIP_trans_path + \'df_CMIP_t300.csv\',index = None)
del df_CMIP_t300
gc.collect()

df_CMIP_ua   = trans_thre_df(df = df_CMIP_ua,   vals   = np.array(nc_CMIP[\'ua\'][:]),   lats = lats, lons = lons, years = years, months = months)
df_CMIP_ua.to_csv(CMIP_trans_path + \'df_CMIP_ua.csv\',index = None)
del df_CMIP_ua
gc.collect()

df_CMIP_va   = trans_thre_df(df = df_CMIP_va,   vals   = np.array(nc_CMIP[\'va\'][:]),   lats = lats, lons = lons, years = years, months = months)
df_CMIP_va.to_csv(CMIP_trans_path + \'df_CMIP_va.csv\',index = None)
del df_CMIP_va
gc.collect()
(36036, 1729)
3.数据建模
工具包导入&数据读取
工具包导入
import pandas as pd
import numpy  as np
import tensorflow as tf
from tensorflow.keras.optimizers import Adam
import joblib
from netCDF4 import Dataset
import netCDF4 as nc
import gc
from   sklearn.metrics import mean_squared_error
import numpy as np
from tensorflow.keras.callbacks import LearningRateScheduler, Callback
import tensorflow.keras.backend as K
from tensorflow.keras.layers import *
from tensorflow.keras.models import *
from tensorflow.keras.optimizers import *
from tensorflow.keras.callbacks import *
from tensorflow.keras.layers import Input
%matplotlib inline
数据读取
SODA_label处理
- 标签含义
标签数据为Nino3.4 SST异常指数,数据维度为(year,month)。
CMIP(SODA)_train.nc对应的标签数据当前时刻Nino3.4 SST异常指数的三个月滑动平均值,因此数据维度与维度介绍同训练数据一致
注:三个月滑动平均值为当前月与未来两个月的平均值。
- 将标签转化为我们熟悉的pandas形式
df_SODA_label = pd.read_csv(\'./data/df_SODA_label.csv\')
df_CMIP_label = pd.read_csv(\'./data/df_CMIP_label.csv\')
训练集验证集构建
df_SODA_label[\'year\']  = df_SODA_label[\'year_month\'].apply(lambda x: x[:x.find(\'m\') - 1])
df_SODA_label[\'month\'] = df_SODA_label[\'year_month\'].apply(lambda x: x[x.find(\'m\') :])

df_train = pd.pivot_table(data = df_SODA_label, values = \'label\',index = \'year\', columns = \'month\')
year_new_index    = [\'year_\'.format(i+1)  for i in range(df_train.shape[0])]
month_new_columns = [\'month_\'.format(i+1) for i in range(df_train.shape[1])]
df_train = df_train[month_new_columns].loc[year_new_index]
模型构建
MLP框架
def RMSE(y_true, y_pred):
    return tf.sqrt(tf.reduce_mean(tf.square(y_true - y_pred)))

def RMSE_fn(y_true, y_pred):
    return np.sqrt(np.mean(np.power(np.array(y_true, float).reshape(-1, 1) - np.array(y_pred, float).reshape(-1, 1), 2)))

def build_model(train_feat, test_feat): #allfeatures,
    inp    = Input(shape=(len(train_feat)))

    x = Dense(1024, activation=\'relu\')(inp)
    x = Dropout(0.25)(x)
    x = Dense(512, activation=\'relu\')(x)
    x = Dropout(0.25)(x)
    output = Dense(len(test_feat), activation=\'linear\')(x)
    model  = Model(inputs=inp, outputs=output)

    adam = tf.optimizers.Adam(lr=1e-3,beta_1=0.99,beta_2 = 0.99)
    model.compile(optimizer=adam, loss=RMSE)

    return model
模型训练
feature_cols = [\'month_\'.format(i+1) for i in range(12)]
label_cols   = [\'month_\'.format(i+1) for i in range(12, df_train.shape[1])]
model_mlp = build_model(feature_cols, label_cols)
model_mlp.summary()
Model: "model"
_________________________________________________________________
Layer (type)                 Output Shape              Param #
=================================================================
input_1 (InputLayer)         [(None, 12)]              0
_________________________________________________________________
dense (Dense)                (None, 1024)              13312
_________________________________________________________________
dropout (Dropout)            (None, 1024)              0
_________________________________________________________________
dense_1 (Dense)              (None, 512)               524800
_________________________________________________________________
dropout_1 (Dropout)          (None, 512)               0
_________________________________________________________________
dense_2 (Dense)              (None, 24)                12312
=================================================================
Total params: 550,424
Trainable params: 550,424
Non-trainable params: 0
_________________________________________________________________
tr_len = int(df_train.shape[0] * 0.8)
tr_fea     = df_train[feature_cols].iloc[:tr_len,:].copy()
tr_label   = df_train[label_cols].iloc[:tr_len,:].copy()

val_fea     = df_train[feature_cols].iloc[tr_len:,:].copy()
val_label   = df_train[label_cols].iloc[tr_len:,:].copy()


model_weights = \'./user_data/model_data/model_mlp_baseline.h5\'

checkpoint = ModelCheckpoint(model_weights, monitor=\'val_loss\', verbose=0, save_best_only=True, mode=\'min\',
                             save_weights_only=True)

plateau        = ReduceLROnPlateau(monitor=\'val_loss\', factor=0.5, patience=5, verbose=1, min_delta=1e-4, mode=\'min\')
early_stopping = EarlyStopping(monitor="val_loss", patience=20)
history        = model_mlp.fit(tr_fea.values, tr_label.values,
                    validation_data=(val_fea.values, val_label.values),
                    batch_size=4096, epochs=200,
                    callbacks=[plateau, checkpoint, early_stopping],
                    verbose=2)
Epoch 00053: ReduceLROnPlateau reducing learning rate to 6.25000029685907e-05.
1/1 - 0s - loss: 0.6567 - val_loss: 0.6030
Epoch 54/200
1/1 - 0s - loss: 0.6571 - val_loss: 0.6030
Epoch 55/200
1/1 - 0s - loss: 0.6541 - val_loss: 0.6030
Epoch 56/200
1/1 - 0s - loss: 0.6539 - val_loss: 0.6030
Epoch 57/200
1/1 - 0s - loss: 0.6477 - val_loss: 0.6030
Epoch 58/200

Epoch 00058: ReduceLROnPlateau reducing learning rate to 3.125000148429535e-05.
1/1 - 0s - loss: 0.6498 - val_loss: 0.6029
Epoch 59/200
1/1 - 0s - loss: 0.6451 - val_loss: 0.6029
Epoch 60/200
1/1 - 0s - loss: 0.6458 - val_loss: 0.6029
Metrics
def rmse(y_true, y_preds):
    return np.sqrt(mean_squared_error(y_pred = y_preds, y_true = y_true))

def score(y_true, y_preds):
    accskill_score = 0
    rmse_score     = 0
    a = [1.5] * 4 + [2] * 7 + [3] * 7 + [4] * 6
    y_true_mean = np.mean(y_true,axis=0)
    y_pred_mean = np.mean(y_true,axis=0)

    for i in range(24):
        fenzi = np.sum((y_true[:,i] -  y_true_mean[i]) *(y_preds[:,i] -  y_pred_mean[i]) )
        fenmu = np.sqrt(np.sum((y_true[:,i] -  y_true_mean[i])**2) * np.sum((y_preds[:,i] -  y_pred_mean[i])**2) )
        cor_i= fenzi / fenmu

        accskill_score += a[i] * np.log(i+1) * cor_i

        rmse_score += rmse(y_true[:,i], y_preds[:,i])
    return  2 / 3.0 * accskill_score - rmse_score
y_val_preds = model_mlp.predict(val_fea.values, batch_size=1024)
print(\'score\', score(y_true = val_label.values, y_preds = y_val_preds))
4.模型预测
模型构建
在上面的部分,我们已经训练好了模型,接下来就是提交模型并在线上进行预测,这块可以分为三步:
- 导入模型;
- 读取测试数据并且进行预测;
- 生成提交所需的版本;
import tensorflow as tf
import tensorflow.keras.backend as K
from tensorflow.keras.layers import *
from tensorflow.keras.models import *
from tensorflow.keras.optimizers import *
from tensorflow.keras.callbacks import *
from tensorflow.keras.layers import Input
import numpy as np
import os
import zipfile

def RMSE(y_true, y_pred):
    return tf.sqrt(tf.reduce_mean(tf.square(y_true - y_pred)))

def build_model(train_feat, test_feat): #allfeatures,
    inp    = Input(shape=(len(train_feat)))

    x = Dense(1024, activation=\'relu\')(inp)
    x = Dropout(0.25)(x)
    x = Dense(512, activation=\'relu\')(x)
    x = Dropout(0.25)(x)
    output = Dense(len(test_feat), activation=\'linear\')(x)
    model  = Model(inputs=inp, outputs=output)

    adam = tf.optimizers.Adam(lr=1e-3,beta_1=0.99,beta_2 = 0.99)
    model.compile(optimizer=adam, loss=RMSE)

    return model

feature_cols = [\'month_\'.format(i+1) for i in range(12)]
label_cols   = [\'month_\'.format(i+1) for i in range(12, 36)]
model = build_model(train_feat=feature_cols, test_feat=label_cols)
model.load_weights(\'./user_data/model_data/model_mlp_baseline.h5\')
模型预测
test_path = \'./tcdata/enso_round1_test_20210201/\'

### 0. 模拟线上的测试集合
# for i in range(10):
#     x = np.random.random(12)
#     np.save(test_path + ".npy".format(i+1),x)

### 1. 测试数据读取
files = os.listdir(test_path)
test_feas_dict =
for file in files:
    test_feas_dict[file] = np.load(test_path + file)

### 2. 结果预测
test_predicts_dict =
for file_name,val in test_feas_dict.items():
    test_predicts_dict[file_name] = model.predict(val.reshape([-1,12]))
#     test_predicts_dict[file_name] = model.predict(val.reshape([-1,12])[0,:])

### 3.存储预测结果
for file_name,val in test_predicts_dict.items():
    np.save(\'./result/\' + file_name,val)
打包到run.sh目录下方
#打包目录为zip文件
def make_zip(source_dir=\'./result/\', output_filename = \'result.zip\'):
    zipf = zipfile.ZipFile(output_filename, \'w\')
    pre_len = len(os.path.dirname(source_dir))
    source_dirs = os.walk(source_dir)
    print(source_dirs)
    for parent, dirnames, filenames in source_dirs:
        print(parent, dirnames)
        for filename in filenames:
            if \'.npy\' not in filename:
                continue
            pathfile = os.path.join(parent, filename)
            arcname = pathfile[pre_len:].strip(os.path.sep)   #相对路径
            zipf.write(pathfile, arcname)
    zipf.close()
make_zip()
项目链接以及码源
云端链接:
人工智能创新挑战赛海洋气象预测Baseline[4]完整版
更多文章请关注公重号:汀丶人工智能

5.提升方向
模型性能提升可以参考:在下述基础上改动
“AI Earth”人工智能创新挑战赛:助力精准气象和海洋预测Baseline[2]:数据探索性分析(温度风场可视化)、CNN+LSTM模型建模
“AI Earth”人工智能创新挑战赛:助力精准气象和海洋预测Baseline[3]:TCNN+RNN模型、SA-ConvLSTM模型
- 模型角度:我们只使用了简单的MLP模型进行建模,可以考虑使用其它的更加fancy的模型进行尝试;
- 数据层面:构建一些特征或者对数据进行一些数据变换等;
- 针对损失函数设计各种trick的提升技巧;
钉钉杯大学生大数据挑战赛初赛 A:银行卡电信诈骗危险预测 Baseline
【钉钉杯大学生大数据挑战赛】初赛 A:银行卡电信诈骗危险预测 Baseline

目录
- 【钉钉杯大学生大数据挑战赛】初赛 A:银行卡电信诈骗危险预测 Baseline
- 1 题目
- 2 Python实现
- 3 完整代码
1 题目
一、问题背景:
数字支付正在发展,但网络犯罪也在发展。电信诈骗案件持续高发,消费者 受损比例持续走高。报告显示,64%的被调查者曾使用手机号码同时注册多个账户,包括金融类账户、社交类账户和消费类账户等,其中遭遇过电信诈骗并发生 损失的比例过半。用手机同时注册金融类账户及其他账户,如发生信息泄露,犯 罪分子更易接管金融支付账户盗取资金。
随着移动支付产品创新加快,各类移动支付在消费群体中呈现分化趋势,第三方支付的手机应用丰富的场景受到年轻人群偏爱,支付方式变多也导致个人信 息也极易被不法分子盗取。根据数据泄露指数,每天有超过 500 万条记录被盗, 这一令人担忧的统计数据表明 - 对于有卡支付和无卡支付类型的支付,欺诈仍 然非常普遍。
在今天的数字世界,每天有数万亿的银行卡交易发生,检测欺诈行为的发生 是一个严峻挑战。
二、数据描述:
该数据来自一些匿名的数据采集机构,数据共有七个特征和一列类标签。下 面对数据特征进行一些简单的解释(每列的含义对我们来说并不重要,但对于机 器学习来说,它可以很容易地发现含义。它有点抽象,但并不需要真正了解每个 功能的真正含义。只需了解如何使用它以便您的模型可以学习。许多数据集,尤 其是金融领域的数据集,通常会隐藏一条数据所代表的内容,因为它是敏感信息。 数据所有者不想让他人知道,并且数据开发人员从法律上讲也无权知道)
-
**distance_from_home:**银行卡交易地点与家的距离;
-
**distance_from_last_transaction:**与上次交易发生的距离;
-
**ratio_to_median_purchase_price:**近一次交易与以往交易价格中位数的比率;
-
**repeat_retailer:**交易是否发生在同一个商户;
-
**used_chip:**是通过芯片(银行卡)进行的交易;
-
**used_pin_number:**交易时是否使用了 PIN码;
-
**online_order:**是否是在线交易订单;
-
**fraud:**诈骗行为(分类标签);
三、解决问题:
(1)使用多种用于数据挖掘的机器学习模型对给定数据集进行建模;
(2)对样本数据进一步挖掘分析,通过交叉验证、网格调优对不同模型的参 数进行调整,寻找最优解,将多个最优模型进行进一步比较;
(3)通过对 precision(预测精度)、recall(召回率)、f1-score(F1 分 数值)进行计算,给出选择某一种预测模型的理由;
(4)将模型性能评价通过多种作图方式进行可视化
2 Python实现
2.1 数据分析与探索
(1)读取数据
import datetime
import numpy as np
import pandas as pd
import numpy as np
from tqdm import tqdm
tqdm.pandas()
import csv
import os
import pickle
import matplotlib.pyplot as plt
import seaborn as sns
plt.rcParams['font.sans-serif']=['SimHei']
plt.rcParams['axes.unicode_minus']=False
train = pd.read_csv('card_transdata.csv')
train

可以看到有100万条数据,
train.columns
Index([‘distance_from_home’, ‘distance_from_last_transaction’, ‘ratio_to_median_purchase_price’, ‘repeat_retailer’, ‘used_chip’, ‘used_pin_number’, ‘online_order’, ‘fraud’], dtype=‘object’)
以下分析以前1000个数据为例
label = train[:1000]['fraud']
x_train = train[:1000][['distance_from_home', 'distance_from_last_transaction',
       'ratio_to_median_purchase_price', 'repeat_retailer', 'used_chip',
       'used_pin_number', 'online_order']]
(2)缺失值查看
for i in range(len(x_train.columns)):
    print(train.T.isna().iloc[i].value_counts())
False 1000000 Name: distance_from_home, dtype: int64
False 1000000 Name: distance_from_last_transaction, dtype: int64
False 1000000 Name: ratio_to_median_purchase_price, dtype: int64
False 1000000 Name: repeat_retailer, dtype: int64
False 1000000 Name: used_chip, dtype: int64
False 1000000 Name: used_pin_number, dtype: int64
False 1000000 Name: online_order, dtype: int64
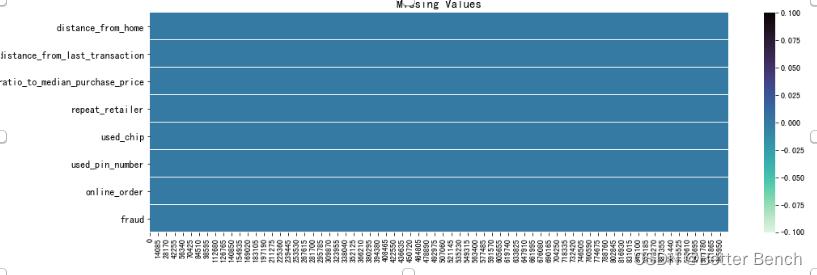
没有缺失值
也可以可视化查看
f, ax = plt.subplots(nrows=1, ncols=1, figsize=(16,5))
sns.heatmap(train.T.isna(), cmap='mako_r')
ax.set_title('Missing Values', fontsize=15)

for tick in ax.yaxis.get_major_ticks():
    tick.label.set_fontsize(12)
plt.show()
(3)异常值查看
from sklearn.preprocessing import MinMaxScaler
import matplotlib.pyplot as plt
x_train = train[:1000][['distance_from_home', 'distance_from_last_transaction','ratio_to_median_purchase_price', 'repeat_retailer', 'used_chip','used_pin_number', 'online_order']]
scaler = MinMaxScaler()
scaler = scaler.fit(x_train)  # 本质生成 max(x) 和 min(x)
data = scaler.transform(x_train)

plt.grid(True)  # 显示网格
# 绘制箱线图 #, labels=list("ABCDEFG"))#,
plt.boxplot(data, labels=list("ABCDEFG"), sym="r+", showmeans=True)
plt.show()  # 显示图片
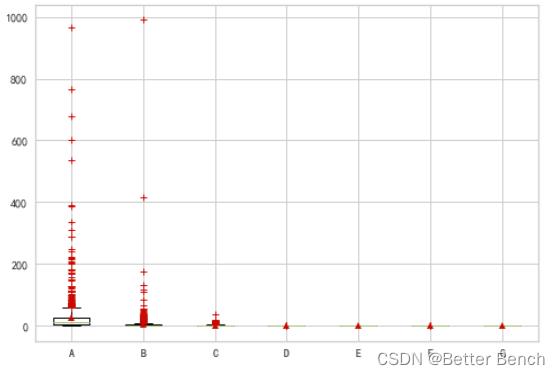
distance_from_home、distance_from_last_transaction、ratio_to_median_purchase_price中异常值较多,‘repeat_retailer’, ‘used_chip’,‘used_pin_number’, 'online_order’是二分类的类别特征
2.2 K折模型训练和网格调参
2.2.1 支持向量机回归SVR
from sklearn.svm import SVR     # 引入SVR类
from sklearn.pipeline import make_pipeline   # 引入管道简化学习流程
from sklearn.preprocessing import StandardScaler # 由于SVR基于距离计算,引入对数据进行标准化的类
from sklearn.model_selection import GridSearchCV  # 引入网格搜索调优
from sklearn.model_selection import cross_val_score # 引入K折交叉验证
X = x_train
y = label
pipe_SVR = make_pipeline(StandardScaler(),SVR())
score1 = cross_val_score(estimator=pipe_SVR,
                                            X = X,
                                            y = y,
                                            scoring = 'r2',
                                            cv = 10)       # 10折交叉验证
print("10折 CV 准确率: %.3f" % ((np.mean(score1))))
10折 CV 准确率: 0.679
# 下面我们使用网格搜索来对SVR调参:
from sklearn.pipeline import Pipeline
pipe_svr = Pipeline([("StandardScaler",StandardScaler()),
                                                         ("svr",SVR())])
param_range = [0.0001,0.001,0.01,0.1,1.0,10.0,100.0,1000.0]
param_grid = ["svr__C":param_range,"svr__kernel":["linear"],  # 注意__是指两个下划线,一个下划线会报错的
                            "svr__C":param_range,"svr__gamma":param_range,"svr__kernel":["rbf"]]
gs = GridSearchCV(estimator=pipe_svr,
                                                     param_grid = param_grid,
                                                     scoring = 'r2',
                                                      cv = 10)       # 10折交叉验证
gs = gs.fit(X,y)
print("网格搜索最优得分:",gs.best_score_)
print("网格搜索最优参数组合:\\n",gs.best_params_)
网格搜索最优得分: 0.6910531241525832
网格搜索最优参数组合: ‘svr__C’: 10.0, ‘svr__gamma’: 0.1, ‘svr__kernel’: ‘rbf’
2.2.2 支持向量机SVM
from sklearn.model_selection import GridSearchCV
def blind_gridsearch(model, X, y):
    C_range = np.logspace(-2, 10, 5)
    gamma_range = np.logspace(-5, 5, 5)
    param_grid = dict(gamma=gamma_range, C=C_range)
    grid = GridSearchCV(SVC(), param_grid=param_grid)
    grid.fit(X, y)
    print(
        'The best parameters are  with a score of :0.2f.'.format(
            grid.best_params_, grid.best_score_
        )
    )
。。。略
blind_gridsearch(SVC(), features, labels)
The best parameters are ‘C’: 10000000000.0, ‘gamma’: 1e-05 with a score of 0.97.
2.2.3 XGBoost
# 导包
import re
import os
from sqlalchemy import create_engine
import warnings
warnings.filterwarnings('ignore')
import sklearn
from sklearn.model_selection import train_test_split
from sklearn.metrics import roc_curve,roc_auc_score
import xgboost as xgb
from xgboost.sklearn import XGBClassifier
import matplotlib.pyplot as plt
import gc
from sklearn import metrics
from sklearn.model_selection import cross_val_predict,cross_validate

# 设定xgb参数
params=
    'objective':'binary:logistic'
    ,'eval_metric':'auc'
    ,'n_estimators':500
    ,'eta':0.03
    ,'max_depth':3
    ,'min_child_weight':100
    ,'scale_pos_weight':1
    ,'gamma':5
    ,'reg_alpha':10
    ,'reg_lambda':10
    ,'subsample':0.7
    ,'colsample_bytree':0.7
    ,'seed':123

。。。略
scores
‘fit_time’: array([0.19092107, 0.11930871, 0.10201693, 0.2144227 , 0.10833335]),
‘score_time’: array([0.00347257, 0.01546097, 0.003299 , 0.00402188, 0.01078582]),
‘test_roc_auc’: array([0.5, 0.5, 0.5, 0.5, 0.5]),
‘train_roc_auc’: array([0.5, 0.5, 0.5, 0.5, 0.5])
# 调参
from sklearn.model_selection import GridSearchCV
train=train[:1000].head(900)
test=train[:1000].tail(100)

param_value_dics=
                   'n_estimators':range(100,900,500),
                   'eta':np.arange(0.02,0.2,0.1),
                   'max_depth':range(3,5,1),
#                    'num_leaves':range(10,30,10),
#                    'min_child_weight':range(300,1500,500),


xgb_model=XGBClassifier(**params)
clf=GridSearchCV(xgb_model,param_value_dics,scoring='roc_auc',n_jobs=-1,cv=5,return_train_score=True)
clf.fit(x_train, y)
GridSearchCV(cv=5,
estimator=XGBClassifier(base_score=None, booster=None,
colsample_bylevel=None,
colsample_bynode=None,
colsample_bytree=0.7,
enable_categorical=False, eta=0.03,
eval_metric=‘auc’, gamma=5, gpu_id=None,
importance_type=None,
interaction_constraints=None,
learning_rate=None, max_delta_step=None,
max_depth=3, min_child_weight=100,
missing=nan, monoton…e,
n_estimators=500, n_jobs=None,
num_parallel_tree=None, predictor=None,
random_state=None, reg_alpha=10,
reg_lambda=10, scale_pos_weight=1,
seed=123, subsample=0.7, tree_method=None,
validate_parameters=None, …),
n_jobs=-1,
param_grid=‘eta’: array([0.02, 0.12]), ‘max_depth’: range(3, 5),
‘n_estimators’: range(100, 900, 500),
return_train_score=True, scoring=‘roc_auc’)
clf.best_estimator_
XGBClassifier(base_score=0.5, booster=‘gbtree’, colsample_bylevel=1,
colsample_bynode=1, colsample_bytree=0.7,
enable_categorical=False, eta=0.02, eval_metric=‘auc’, gamma=5,
gpu_id=-1, importance_type=None, interaction_constraints=‘’,
learning_rate=0.0199999996, max_delta_step=0, max_depth=3,
min_child_weight=100, missing=nan, monotone_constraints=‘()’,
n_estimators=100, n_jobs=6, num_parallel_tree=1, predictor=‘auto’,
random_state=123, reg_alpha=10, reg_lambda=10, scale_pos_weight=1,
seed=123, subsample=0.7, tree_method=‘exact’,
validate_parameters=1, …)
2.3 特征工程
2.3.1 特征分析
平行坐标是多维特征直轴被水平复制用于每个特征。实例显示为从每个垂直轴到代表该特征值的位置绘制的一条线段。这允许同时可视化许多维度;事实上,给定无限的水平空间(例如滚动窗口),技术上可以显示无限数量的维度!
# 安装包:pip install yellowbrick - i https: // pypi.tuna.tsinghua.edu.cn/simple
from yellowbrick.features import ParallelCoordinates

# Load the classification data set
X = x_train
y = label
# Specify the features of interest and the classes of the target
features = ['distance_from_home', 'distance_from_last_transaction',
       'ratio_to_median_purchase_price', 'repeat_retailer', 'used_chip',
       'used_pin_number', 'online_order'
]
classes = ["unoccupied", "occupied"]

# Instantiate the visualizer
。。。略

# Fit and transform the data to the visualizer
visualizer.fit_transform(X, y)

# Finalize the title and axes then display the visualization
visualizer.show()
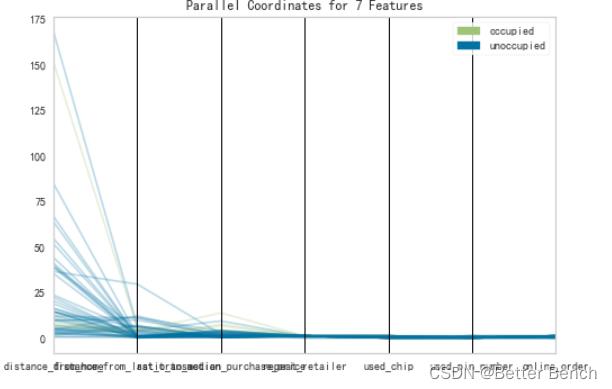
RadViz是一种多元数据可视化算法,它围绕一个圆的圆周均匀地绘制每个特征尺寸,然后在圆的内部绘制点,以便该点将其在从中心到每个弧的轴上的值标准化。这种机制允许尽可能多的维度适合一个圆,极大地扩展了可视化的维度。
# 安装包:pip install yellowbrick - i https: // pypi.tuna.tsinghua.edu.cn/simple
from yellowbrick.features import RadViz

# Load the classification dataset
X = x_train
y = label

# Specify the target classes
classes = ["unoccupied", "occupied"]

# Instantiate the visualizer
。。。略

visualizer.fit(X, y)           # Fit the data to the visualizer
visualizer.transform(X)        # Transform the data
visualizer.show()
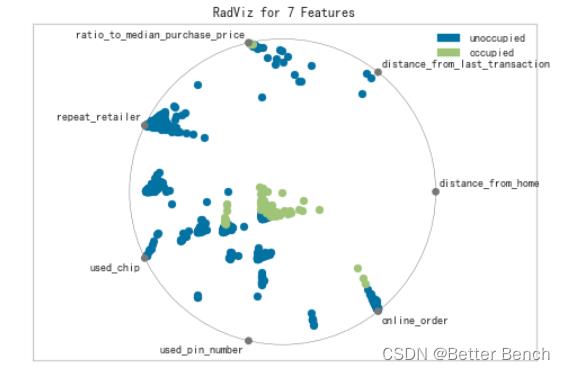
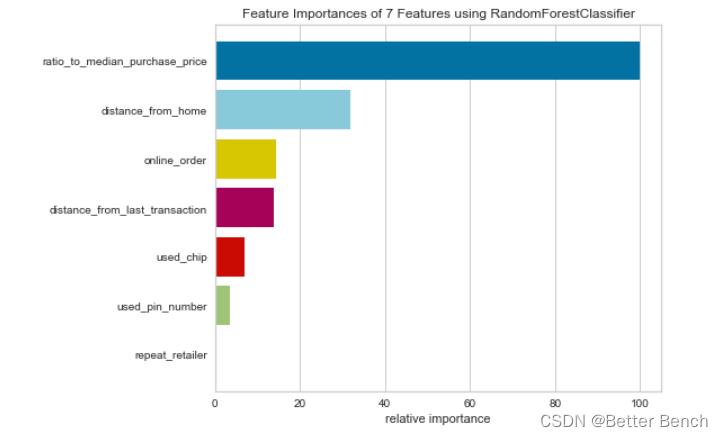
2…3.1 特征重要性可视化
from sklearn.ensemble import RandomForestClassifier
from yellowbrick.model_selection import FeatureImportances

# Load the classification data set
X = x_train
y = label

。。。略
viz = FeatureImportances(model)
viz.fit(X, y)
viz.show()
2.3.3 特征选取
from sklearn.svm import SVC
from sklearn.datasets import make_classification

from yellowbrick.model_selection import RFECV

# Create a dataset with only 3 informative features
。。。略
# Load the classification dataset
X = x_train
y = label
# Instantiate RFECV visualizer with a linear SVM classifier
visualizer = RFECV(SVC(kernel='linear', C=1))

visualizer.fit(X, y)        # Fit the data to the visualizer
visualizer.show()

2.4 模型评价
2.4.1 LogisticRegression模型评价ROC曲线
from sklearn.linear_model import LogisticRegression
from sklearn.model_selection import train_test_split
from yellowbrick.classifier import ROCAUC

# Load the classification dataset
X=x_train[['distance_from_home', 'distance_from_last_transaction',
       'ratio_to_median_purchase_price', 'repeat_retailer', 'used_chip',
       'used_pin_number', 'online_order']]
y = label

# Create the training and test data
X_train, X_test, y_train, y_test = train_test_split(X, y, random_state=42)

# Instantiate the visualizer with the classification model
model = LogisticRegression(multi_class="auto", solver="liblinear")
visualizer = ROCAUC(model, classes=["not_fraud", "is_fraud"])

visualizer.fit(X_train, y_train)        # Fit the training data to the visualizer
visualizer.score(X_test, y_test)        # Evaluate the model on the test data
visualizer.show()
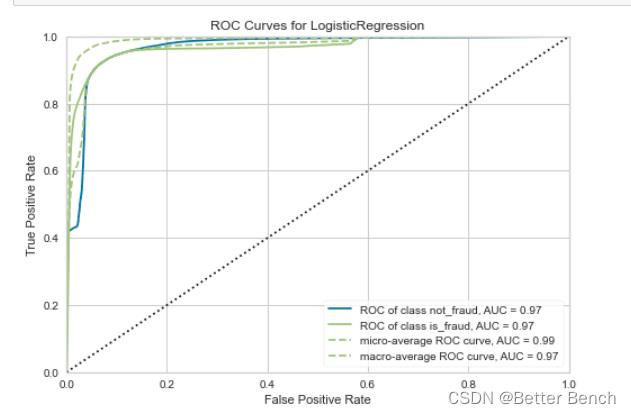
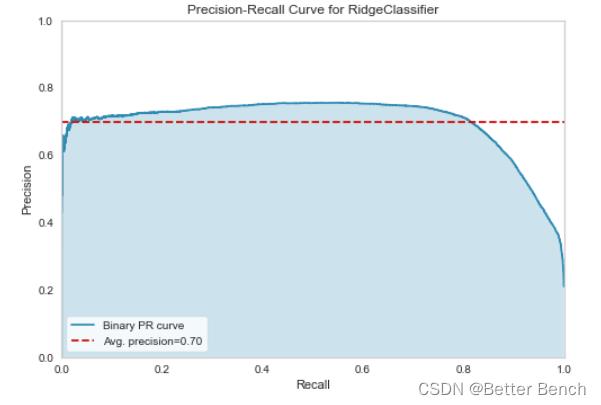
2.4.2 Precision-Recall Curves 召回率
import matplotlib.pyplot as plt
from sklearn.linear_model import RidgeClassifier
from yellowbrick.classifier import PrecisionRecallCurve
from sklearn.model_selection import train_test_split as tts

# Load the dataset and split into train/test splits
X = x_train
y = label

X_train, X_test, y_train, y_test = tts(
    X, y, test_size=0.2, shuffle=True, random_state=0
)

# Create the visualizer, fit, score, and show it
viz = PrecisionRecallCurve(RidgeClassifier(random_state=0))
viz.fit(X_train, y_train)
viz.score(X_test, y_test)
viz.show()
# Specify class weights to shift the threshold towards spam classification
weights = 0:0.2, 1:0.8

# Create the visualizer, fit, score, and show it
viz = PrecisionRecallCurve(
    LogisticRegression(class_weight=weights, random_state=0)
)
viz.fit(X_train, y_train)
viz.score(X_test, y_test)
viz.show()
2.4.3 混淆矩阵
from yellowbrick.classifier import confusion_matrix
from sklearn.linear_model import LogisticRegression
from sklearn.model_selection import train_test_split as tts

# Instantiate the visualizer with the classification model
confusion_matrix(
    LogisticRegression(),
    X_train, y_train, X_test, y_test,
    classes=['not_defaulted', 'defaulted']
)
plt.tight_layout()
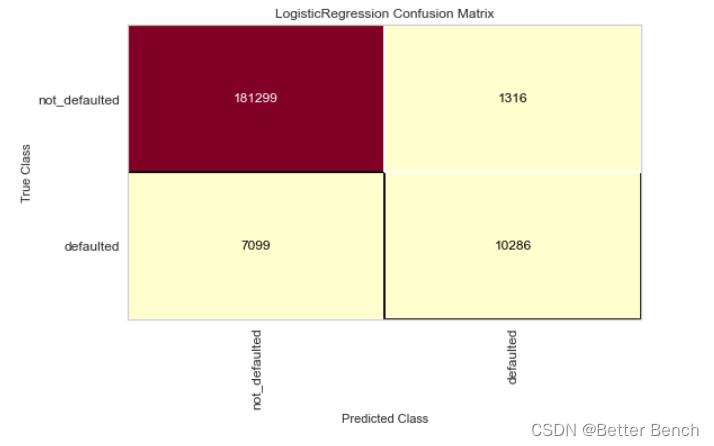
2.4.4 Discrimination Threshold 甄别阈
from sklearn.linear_model import LogisticRegression
from yellowbrick.classifier import DiscriminationThreshold
X = x_train
y = label
# Instantiate the classification model and visualizer
。。。略

visualizer.fit(X, y)        # Fit the data to the visualizer
visualizer.show()
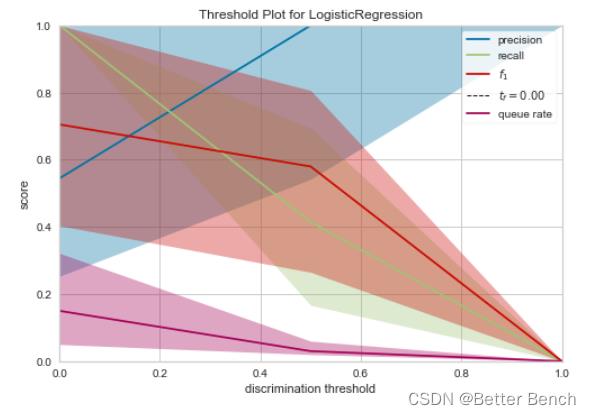
2.4.5 F1值+Presion+recall
from sklearn.model_selection import TimeSeriesSplit
from sklearn.naive_bayes import GaussianNB
from yellowbrick.classifier import ClassificationReport

X = x_train
y = label
# Specify the target classes
classes = ['not_defaulted', 'defaulted']

# Create the training and test data
tscv = TimeSeriesSplit()
for train_index, test_index in tscv.split(X):
    X_train, X_test = X.iloc[train_index], X.iloc[test_index]
    y_train, y_test = y.iloc[train_index], y.iloc[test_index]

# Instantiate the classification model and visualizer
。。。略

visualizer.fit(X_train, y_train)        # Fit the visualizer and the model
visualizer.score(X_test, y_test)        # Evaluate the model on the test data
visualizer.show()
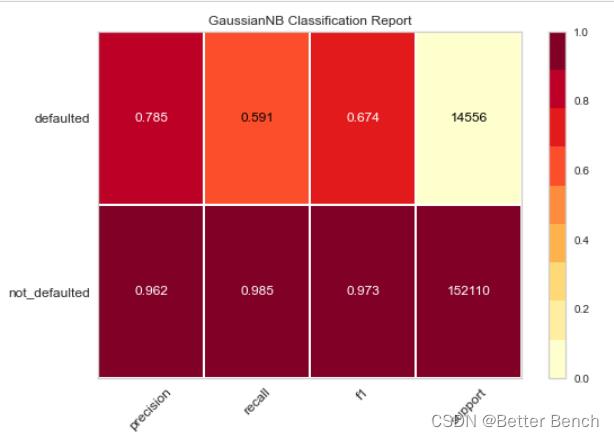
2.4.6 类预测误差
from sklearn.model_selection import train_test_split
from sklearn.ensemble import RandomForestClassifier
from yellowbrick.classifier import ClassPredictionError
from yellowbrick.datasets import load_credit

X = x_train
y = label
# Specify the target classes
classes = ['not_defaulted', 'defaulted']

# Perform 80/20 training/test split
X_train, X_test, y_train, y_test = train_test_split(X, y, test_size=0.20,
                                                    random_state=42)

# Instantiate the classification model and visualizer
。。。略

# Fit the training data to the visualizer
visualizer.fit(X_train, y_train)

# Evaluate the model on the test data
visualizer.score(X_test, y_test)

# Draw visualization
visualizer.show()
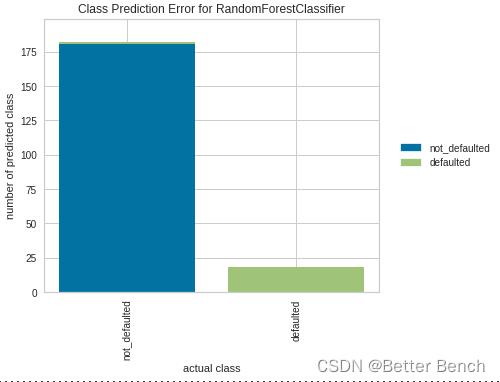
2.5 最终模型可视化
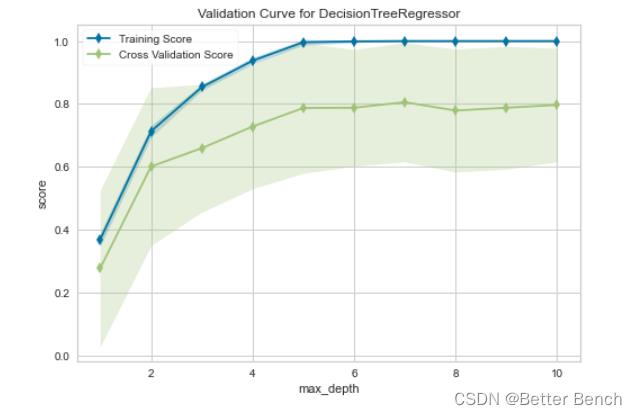
2.5.1 验证曲线
from yellowbrick.model_selection import ValidationCurve
from sklearn.tree import DecisionTreeRegressor

# Load a regression dataset
X = x_train
y = label

。。。略
# Fit and show the visualizer
viz.fit(X, y)
viz.show()
2.5.2 学习曲线