在Vue2项目中遇到的问题汇总
Posted tingbao-zhimeng
tags:
篇首语:本文由小常识网(cha138.com)小编为大家整理,主要介绍了在Vue2项目中遇到的问题汇总相关的知识,希望对你有一定的参考价值。
1 问题1: Proxy error: Could not proxy request /students from localhost:8080 to http://localhost:5000/.See ht
Proxy error: Could not proxy request /students from localhost:8080 to http://localhost:5000/.See ht
终端报错:


浏览器报错

这个里面给的文件没有打开,打开之后就正常了


最后显示:

2 vue-[Vue warn]: data functions should return an object
问题描述
在创建相应的vue页面组件时,引入组件后运行测试即出现现象中的报错问题。如下问题时vue页面开发中常见的一个问题
现象
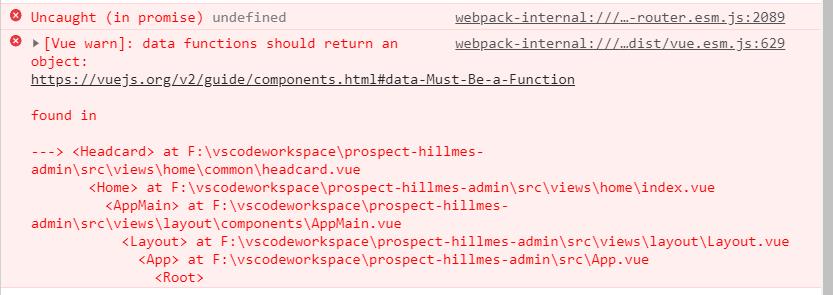
当前问题是指向headcard.vue组件
解决方案
在headcard.vue中添加return返回值
在使用组件化的时候对应的组件中如果没有任何参数,也必须将retur 返回值加上。如果不加上则当前组件的数据会变成全局可视,则造成变量污染。加上return则组件数据只能当前组件可视,不会影响到其他组件
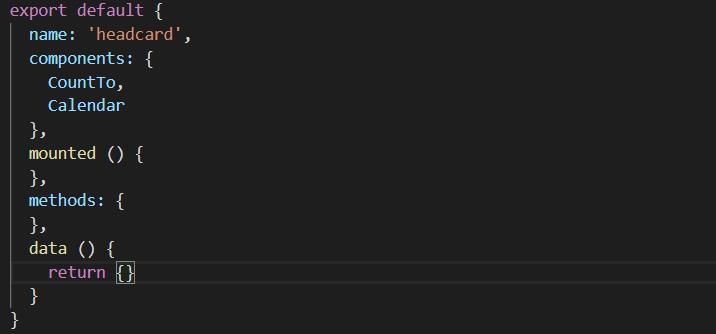
3 问题3 Component name “Home“ should always be multi-word vue/multi-word-component-names
报错!
原因:命名问题
方法:在vue.config.js中添加lintOnSave:false;
const  defineConfig  = require(\'@vue/cli-service\')
module.exports = defineConfig(
  transpileDependencies: true,
  lintOnSave: false
)
//  在vue.config.js中添加lintOnSave:false;
4 问题4:Can’t resolve ‘vue-router’ in (Vue3搭建项目中遇到的问题)
使用Vue-cli搭建好默认项目后,想要用路由功能,但是报错
Can’t resolve ‘vue-router’ in xxxx(某路径)
这是因为缺少包的原因
在命令行中运行一下命令重启项目即可解决
npm install vue-router
但是有在 安装插件的时候出现了错误
这里遇到的错误是:npm vue-router报错
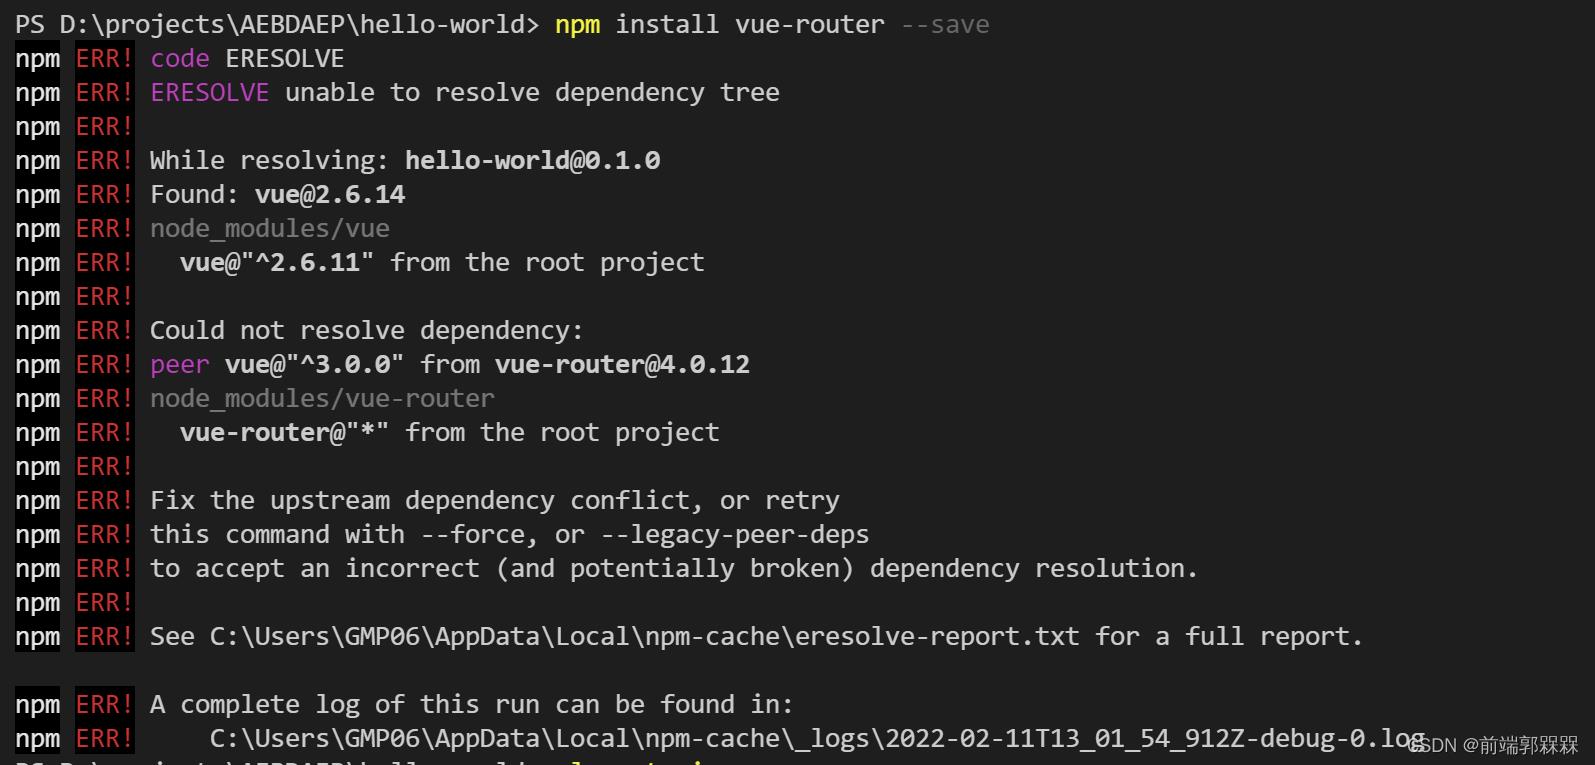
下面在package.json文件的dependencies中添加"vue-router": "^3.5.3"如下图
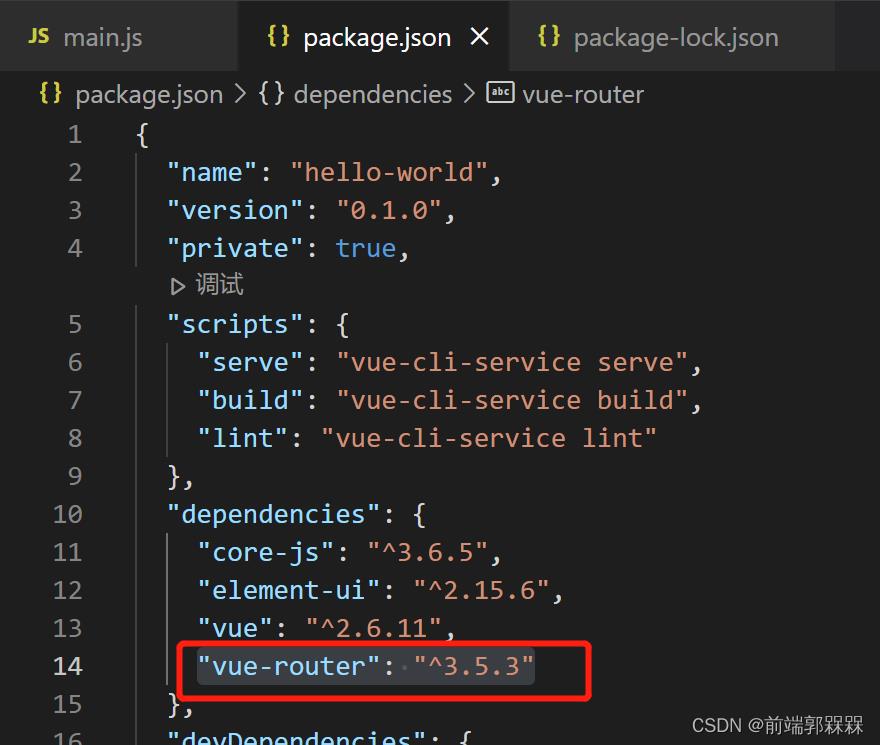
然后再输入npm install vue-router@next --save进行安装就可以安装成功了
5 已声明“ ”,但从未读取其值。ts(6133) 原因及解决方法
在写 js 代码中,创建新的元素标签可能会遇到下面一种情况,告诉我们这个标签元素已声明,但从未读取其值,我们点击下面的快速修复,它又会把这行代码删除。
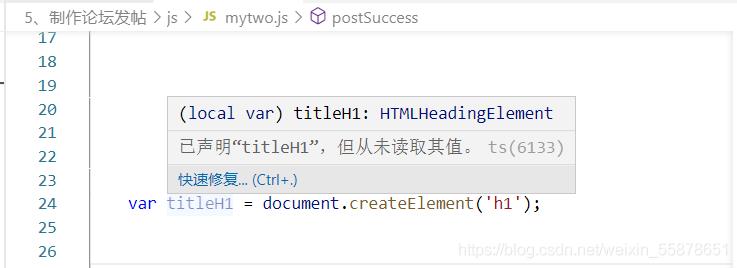
2、这其实不是代码出现错误问题了,只不过是我们没有调用这个标签元素,只需要在后面的代码中使用这个元素标签,它就会恢复正常。

6 Vue 报错: Property or method “handleOpen“ is not defined on the instance but referenced ...
Property or method “xxx” is not defined on the instance but referenced during render. Make sure that this property is reactive, either in the data option, or for class-based components, by initializing the property.
属性或方法“xxx”不是在实例上定义的,而是在呈现期间引用的。通过初始化该属性,确保该属性是反应性的,无论是在data选项中,还是在基于类的组件中。
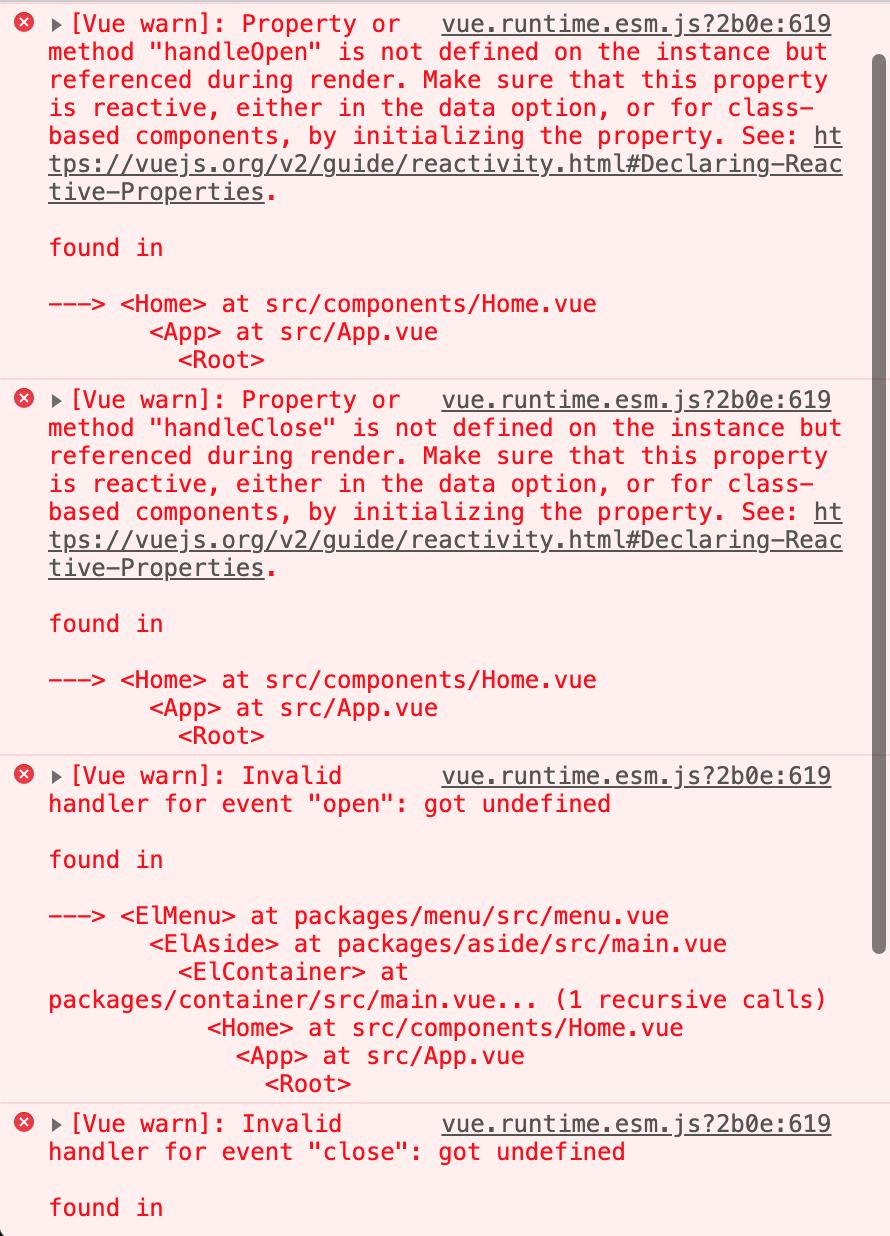
根据关键词全局搜索发现:
某属性或者某方法没有定义,查看data或者methods或者prop
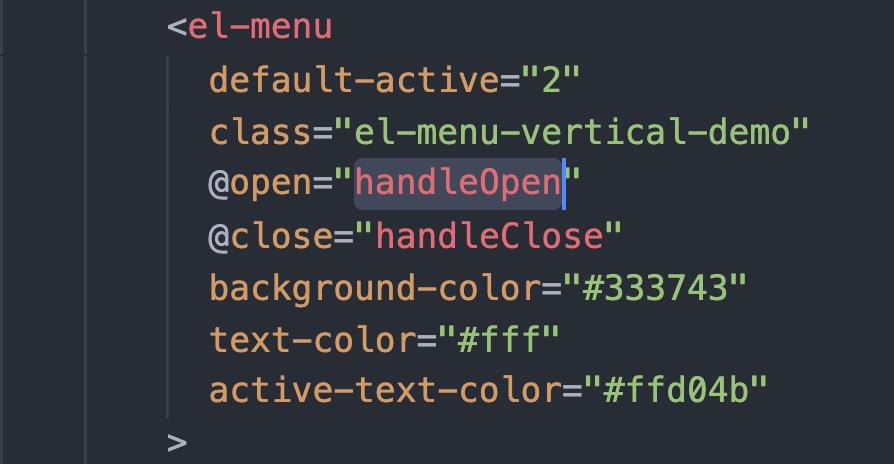
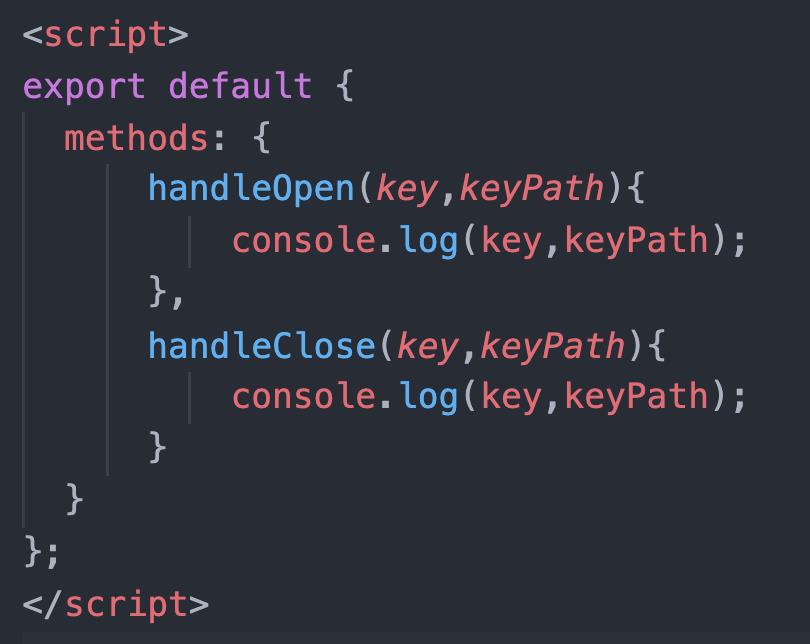
解决:
export default
 data()
  return
    xxx:""
  ,
 methods:
    xxx()

 ,
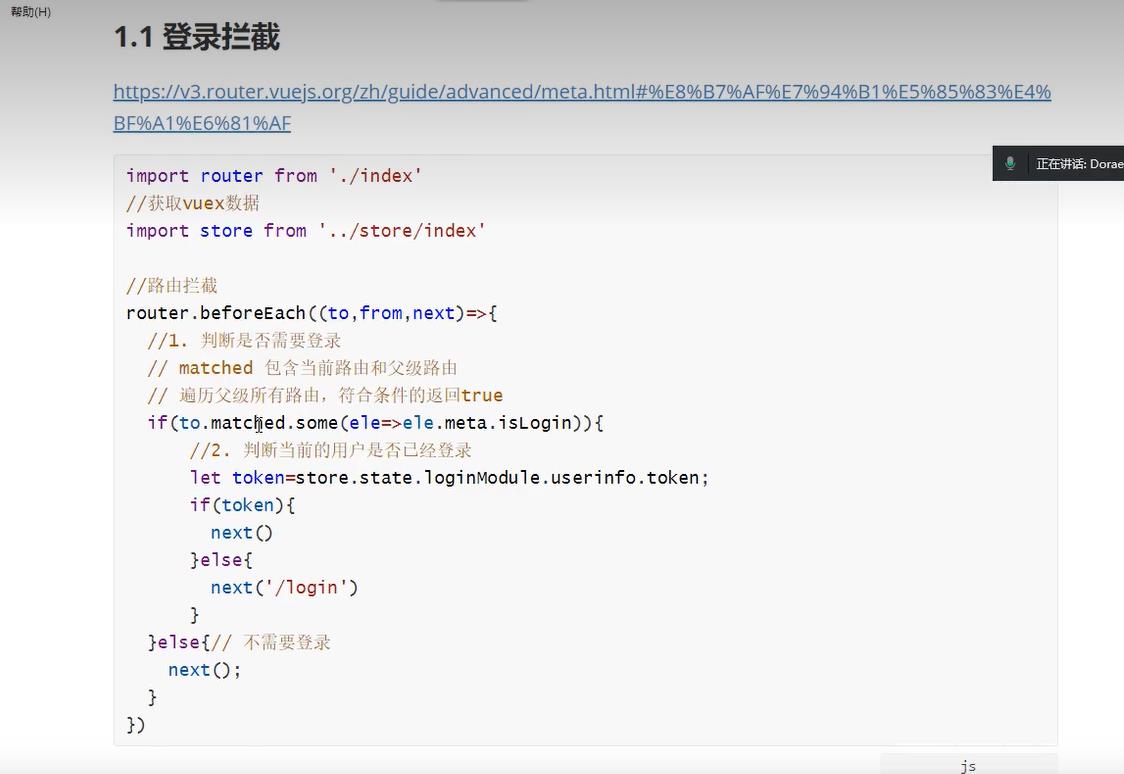
7 解决报错:Uncaught TypeError: Cannot read properties of undefined (reading ‘install‘)

解决办法:
出现该情况的原因是vue-router安装的版本太高,一般vue2的项目对应的版本是vue-router@3版本
①在控制台输入: cnpm install --save vue-router@3.5.3 重新安装vue-router即可解决
如果没有安装cnpm命令的,可以先安装:cnpm install
②如果安装了cnpm 命令,则在控制台输入: cnpm install --save vue-router@3.5.3 重新安装vue-router即可解决
③没有cnpm命令 也可 则在控制台输入: npm install --save vue-router@3.5.3 重新安装vue-router即可解决
vue项目之echarts的整理汇总(持续更新中)
vue项目之echarts的整理汇总(持续更新中)
vue项目之echarts的整理汇总(持续更新中)
echarts安装
这里不多说,npm安装和按需加载可看官网
npm install echarts -S
柱状图和折线图
上手先看效果,不然无法继续进行下去,代码如下

<template>
  <div class="page-two">
    <baseTitleBar
      backgroundColor="#FFF"
      :leftEle="leftEle"
      :title="title"
      titleColor="#000"
    ></baseTitleBar>
    <div id="histogram"></div>
    <div id="linechart"></div>
    <van-button type="primary" @click="handleHistogramData">更新柱状图数据</van-button>
    <van-button type="info" @click="handleLinechartData">更新折线图数据</van-button>
  </div>
</template>

<script>
import baseTitleBar from '@/components/titleBar/baseTitleBar'
import * as echarts from 'echarts'

export default {
  name: 'index',
  components: {
    baseTitleBar
  },
  props: {},
  data() {
    return {
      leftEle: {
        iconName: 'iconback',
        color: '#000',
        fontSize: '.36rem',
        method: this.back
      },
      title: '页面二',
      histogram: null,
      linechart: null,
      fontSize: 0,
      dataNewWeek: [10, 40, 50, 20, 15, 25,30],
      dataLastWeek: [5, 20, 36, 10, 30, 20, 10]
    }
  },
  methods: {
    // 用于处理自适应时元素的宽高比例大小
    handleFontSize(res) {
      let clientWidth =
        window.innerWidth ||
        document.documentElement.clientWidth ||
        document.body.clientWidth
      if (!clientWidth) return
      this.fontSize = 100 * (clientWidth / 1920)
      // console.log(this.fontSize)
      return res * this.fontSize
    },
    // 返回上一层
    back() {
      if (this.$getUserAgent() == 0) {
        try {
          u.native.onBack()
        } catch (e) {
          this.$router.go(-1)
        }
      } else {
        try {
          window.webkit.messageHandlers.onFinish.postMessage('close')
        } catch (e) {
          this.$router.go(-1)
        }
      }
    },
    // 柱状图
    initHistogram() {
      // 这里的判断是打印台 There is a chart instance already initialized on the dom!警告
      if (this.histogram != null &&  this.histogram != "" &&  this.histogram != undefined){
        this.histogram.dispose()
      }
      // 基于准备好的dom,初始化echarts实例
      this.histogram = echarts.init(document.getElementById('histogram'))
      // 绘制图表
      this.histogram.setOption({
        title: {
          text: '指标对比'
        },
        legend: {
          orient: 'vertical',
          left: 'center',
          bottom: 'bottom',
          //设置区分(哪条线属于什么)
          data: ['这周', '上周']
        },
        tooltip: {},
        xAxis: {
          data: ['周一', '周二', '周三', '周四', '周五', '周六', '周日']
        },
        yAxis: {},
        series: [
          {
            name: '这周',
            type: 'bar',
            data: this.dataNewWeek,
            barGap: '0%',
            barWidth: this.handleFontSize(0.8) // 柱图宽度
            // barWidth : 20, // 柱图宽度
          },
          {
            name: '上周',
            type: 'bar',
            data: this.dataLastWeek,
            barGap: '0%',
            // barWidth : this.fontSize(20), // 柱图宽度
            barWidth: this.handleFontSize(0.8) // 柱图宽度
            // barWidth : 20, // 柱图宽度
          }
        ]
      }, true)
    },

    // 折线图
    initLinechart() {
      // 这里的判断是打印台 There is a chart instance already initialized on the dom!警告
      if (this.linechart != null &&  this.linechart != "" &&  this.linechart != undefined){
        this.linechart.dispose()
      }
      // 基于准备好的dom,初始化echarts实例
      this.linechart = echarts.init(document.getElementById('linechart'))
      // 指定图表的配置项和数据
      let option = {
        title: {
          text: '指标对比'
        },
        tooltip: {
          //设置tip提示
          trigger: 'axis'
        },
        legend: {
          orient: 'vertical',
          left: 'center',
          bottom: 'bottom',
          //设置区分(哪条线属于什么)
          data: ['这周', '上周']
        },
        color: ['#8AE09F', '#FA6F53'], //设置区分(每条线是什么颜色,和 legend 一一对应)
        xAxis: {
          //设置x轴
          type: 'category',
          boundaryGap: false, //坐标轴两边不留白
          data: ['10.01', '10.02', '10.03', '10.04', '10.05', '10.06', '10.07'],
          // name: 'DATE', //X轴 name
          nameTextStyle: {
            //坐标轴名称的文字样式
            color: '#FA6F53',
            fontSize: 14,
            padding: [0, 0, 0, 10]
          },
          axisLine: {
            //坐标轴轴线相关设置。
            lineStyle: {
              color: '#FA6F53'
            }
          },
          axisLabel: {
            interval: 0
            // rotate: 50
          }
        },
        yAxis: {
          // name: '指标对比',
          nameTextStyle: {
            color: '#FA6F53',
            fontSize: 16,
            padding: [0, 0, 10, 0]
          },
          axisLine: {
            lineStyle: {
              color: '#FA6F53'
            }
          },
          type: 'value'
        },
        series: [
          {
            name: '这周',
            data: this.dataNewWeek,
            type: 'line', // 类型为折线图
            lineStyle: {
              // 线条样式 => 必须使用normal属性
              normal: {
                color: '#8AE09F'
              }
            }
          },
          {
            name: '上周',
            data: this.dataLastWeek,
            type: 'line',
            lineStyle: {
              normal: {
                color: '#FA6F53'
              }
            }
          }
        ]
      }
      // 使用刚指定的配置项和数据显示图表。
      this.linechart.setOption(option, true)
    },
    handleHistogramData(){
      this.dataNewWeek = [20, 50, 80, 60, 75, 85, 100]
      this.dataLastWeek = [10, 40, 40, 20, 15, 25, 60]
    },
    handleLinechartData(){
      this.dataNewWeek = [20, 50, 80, 60, 75, 85, 100]
      this.dataLastWeek = [10, 40, 40, 20, 15, 25, 60]
    },
  },
  mounted() {
    let _this = this
    this.initHistogram()
    this.initLinechart()
    // 用于处理图表的浏览器窗口自适应
    window.onresize = function () {
      _this.linechart.resize()
      _this.histogram.resize() // 若有多个图表变动,可多写
      _this.handleFontSize() // 窗口变化,更新图表大小视图
    }
  },
  watch: {
    fontSize(){
      this.initHistogram()
      this.initLinechart()
    },
    // 数据更新,更新echarts图表
    dataNewWeek(){
      this.initHistogram()
      this.initLinechart()
    },
  }
}
</script>

<style  lang="scss" scoped>
#histogram {
  width: 100%;
  height: 5rem;
}
#linechart {
  width: 100%;
  height: 5rem;
}
</style>
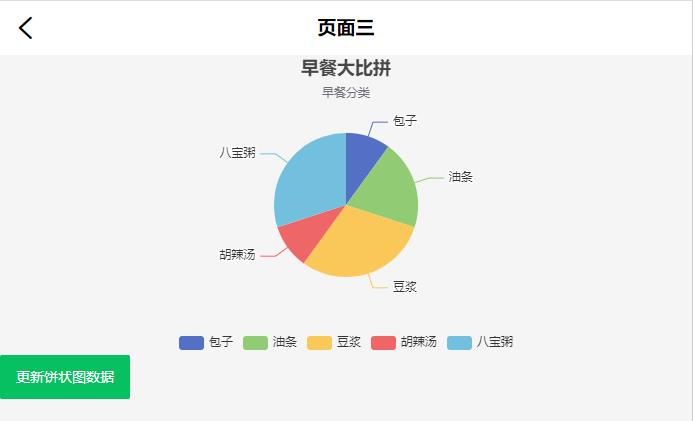
饼状图
上手先看效果,不然无法继续进行下去,代码如下
<template>
  <div class="page-two">
    <baseTitleBar
      backgroundColor="#FFF"
      :leftEle="leftEle"
      :title="title"
      titleColor="#000"
    ></baseTitleBar>
    <div id="piechart"></div>
    <van-button type="primary" @click="handlePiechartData">
      更新饼状图数据
    </van-button>
  </div>
</template>

<script>
import baseTitleBar from '@/components/titleBar/baseTitleBar'
import * as echarts from 'echarts'

export default {
  name: 'index',
  components: {
    baseTitleBar
  },
  props: {},
  data() {
    return {
      leftEle: {
        iconName: 'iconback',
        color: '#000',
        fontSize: '.36rem',
        method: this.back
      },
      title: '页面三',
      piechart: null,
      fontSize: 0,
      pieData: [
        { value: 100, name: '包子' },
        { value: 200, name: '油条' },
        { value: 300, name: '豆浆' },
        { value: 100, name: '胡辣汤' },
        { value: 300, name: '八宝粥' }
      ]
    }
  },
  methods: {
    handleFontSize(res) {
      let clientWidth =
        window.innerWidth ||
        document.documentElement.clientWidth ||
        document.body.clientWidth
      if (!clientWidth) return
      this.fontSize = 100 * (clientWidth / 1920)
      // console.log(this.fontSize)
      return res * this.fontSize
    },
    // 返回上一层
    back() {
      if (this.$getUserAgent() == 0) {
        try {
          u.native.onBack()
        } catch (e) {
          this.$router.go(-1)
        }
      } else {
        try {
          window.webkit.messageHandlers.onFinish.postMessage('close')
        } catch (e) {
          this.$router.go(-1)
        }
      }
    },
    // 饼状图
    initPiechart() {
      // 这里的判断是打印台 There is a chart instance already initialized on the dom!警告
      if (
        this.piechart != null &&
        this.piechart != '' &&
        this.piechart != undefined
      ) {
        this.piechart.dispose()
      }
      // 基于准备好的dom,初始化echarts实例
      this.piechart = echarts.init(document.getElementById('piechart'))
      // 指定图表的配置项和数据
      let option = {
        title: {
          text: '早餐大比拼',
          subtext: '早餐分类',
          left: 'center'
        },
        tooltip: {
          trigger: 'item'
        },
        legend: {
          orient: 'vertical',
          left: 'center',
          bottom:'bottom',
        },
        series: [
          {
            name: 'Access From',
            type: 'pie',
            radius: this.handleFontSize(2), // 饼状图大小
            center: ['50%', '60%'], // 饼状图上下左右的位置
            data: this.pieData,
            emphasis: {
              itemStyle: {
                shadowBlur: 10,
                shadowOffsetX: 0,
                shadowColor: 'rgba(0, 0, 0, 0.5)'
              }
            }
          }
        ]
      }
      // 使用刚指定的配置项和数据显示图表。
      this.piechart.setOption(option, true)
    },
    handlePiechartData() {
      this.pieData = [
        { value: 300, name: '包子' },
        { value: 100, name: '油条' },
        { value: 100, name: '豆浆' },
        { value: 200, name: '胡辣汤' },
        { value: 500, name: '八宝粥' }
      ]
    }
  },
  mounted() {
    let _this = this
    this.initPiechart()
    window.onresize = function () {
      _this.piechart.resize() // 若有多个图表变动,可多写
      _this.handleFontSize() // 窗口变化,更新图表大小视图
    }
  },
  watch: {
    fontSize() {
      this.initPiechart()
    },
    pieData() {
      this.initPiechart()
    }
  }
}
</script以上是关于在Vue2项目中遇到的问题汇总的主要内容,如果未能解决你的问题,请参考以下文章