Python交互图表可视化Bokeh:3. 散点图
Posted kris12
tags:
篇首语:本文由小常识网(cha138.com)小编为大家整理,主要介绍了Python交互图表可视化Bokeh:3. 散点图相关的知识,希望对你有一定的参考价值。
散点图
① 基本散点图绘制
② 散点图颜色、大小设置方法
③ 不同符号的散点图
1. 基本散点图绘制
import numpy as np
import pandas as pd
import matplotlib.pyplot as plt
% matplotlib inline

import warnings
warnings.filterwarnings(\'ignore\')
# 不发出警告

from bokeh.io import output_notebook
output_notebook()
# 导入notebook绘图模块

from bokeh.plotting import figure,show
# 导入图表绘制、图标展示模块

p.circle()
# 1、基本散点图绘制

s = pd.Series(np.random.randn(80))
# 创建数据

p = figure(plot_width=600, plot_height=400)
p.circle(s.index, s.values,                  # x,y值,也可以写成:x=s.index, y = s.values
         size=25, color="navy", alpha=0.5,   # 点的大小、颜色、透明度(注意,这里的color是线+填充的颜色,同时线和填充可以分别上色,参数如下)
         fill_color = \'red\',fill_alpha = 0.6, # 填充的颜色、透明度
         line_color = \'black\',line_alpha = 0.8,line_dash = \'dashed\',line_width = 2,   # 点边线的颜色、透明度、虚线、宽度
         # 同时还有line_cap、line_dash_offset、line_join参数
         legend = \'scatter-circle\',    # 设置图例
         #radius = 2   # 设置点的半径,和size只能同时选一个
        )
# 创建散点图,基本参数
# bokeh对line和fill是同样的设置方法

p.legend.location = "bottom_right"
# 设置图例位置

show(p)

2. 散点图不同 颜色上色/ 散点大小 的方法
两种为散点图颜色上色的方法
# 2、散点图不同 颜色上色/散点大小 的方法
# ① 数据中有一列专门用于设置颜色 / 点大小

from bokeh.palettes import brewer

rng = np.random.RandomState(1)
df = pd.DataFrame(rng.randn(100,2)*100,columns = [\'A\',\'B\'])
# 创建数据,有2列随机值

df[\'size\'] = rng.randint(10,30,100)   # 设置点大小字段

# colormap1 = {1: \'red\', 2: \'green\', 3: \'blue\'}
# df[\'color1\'] = [colormap1[x] for x in rng.randint(1,4,100)]           # 调色盘1;
df[\'color1\'] = np.random.choice([\'red\', \'green\', \'blue\'], 100) #跟上面两行是一样的;  这两种都是在本身的数据中增加size和color1标签,再去绘制图标;

print(df.head())

p = figure(plot_width=600, plot_height=400)
p.circle(df[\'A\'], df[\'B\'],       # 设置散点图x,y值
         line_color = \'white\',   # 设置点边线为白色
         fill_color = df[\'color1\'],fill_alpha = 0.5,   # 设置内部填充颜色,这里用到了颜色字段
         size = df[\'size\']       # 设置点大小,这里用到了点大小字段,按照size的随机数去设置点的大小
        )

show(p)


n = 8
colormap2 = brewer[\'Blues\'][n]
print(colormap2)
df[\'color2\'] = [colormap2[x] for x in rng.randint(0,n,100)]           # 通过调色盘2的方式
print(df.head())
# # 设置颜色字段
# # 通过字典/列表,识别颜色str
# # 这里设置了两个调色盘,第二个为蓝色渐变

p = figure(plot_width=600, plot_height=400)
p.circle(df[\'A\'], df[\'B\'],       # 设置散点图x,y值
         line_color = \'white\',   # 设置点边线为白色
         fill_color = df[\'color2\'],fill_alpha = 0.5,   # 设置内部填充颜色,这里用到了颜色字段
         size = df[\'size\']       # 设置点大小,这里用到了点大小字段,按照size的随机数去设置点的大小
        )

show(p)


# 2、散点图不同 颜色上色/散点大小 的方法
# ② 遍历数据分开做图

rng = np.random.RandomState(1)
df = pd.DataFrame(rng.randn(100,2)*100,columns = [\'A\',\'B\'])
df[\'type\'] = rng.randint(0,7,100)
print(df.head())
# 创建数据;type是做不同类别的一个分组

colors = ["red", "olive", "darkred", "goldenrod", "skyblue", "orange", "salmon"]
# 创建颜色列表

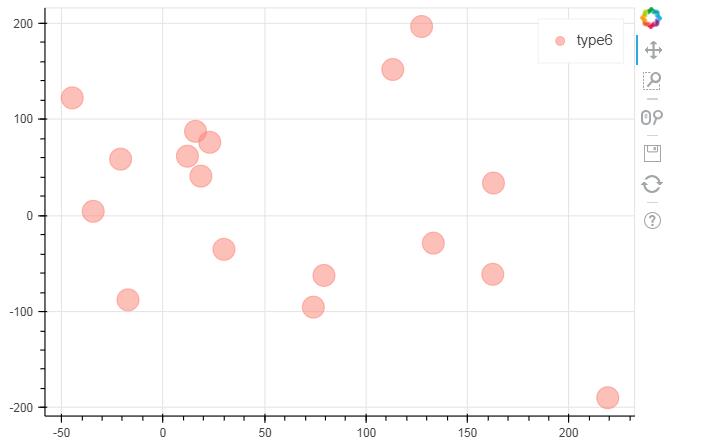
p1 = figure(plot_width=600, plot_height=400)
p2 = figure(plot_width=600, plot_height=400)
p3 = figure(plot_width=600, plot_height=400)
plst = [p1, p2, p3]
# for t in df[\'type\'].unique():
for t,pi in zip(df[\'type\'].unique()[:3], plst):
    #p = figure(plot_width=600, plot_height=400,tools = "pan,wheel_zoom,box_select,lasso_select,reset")
    pi.circle(df[\'A\'][df[\'type\'] == t], df[\'B\'][df[\'type\'] == t],       # 设置散点图x,y值
             size = 20,alpha = 0.5,
             color = colors[t],
             legend = \'type%i\' % t)
    show(pi)

# 通过分类设置颜色


3. 不同符号的散点图
# 3、不同符号的散点图
# asterisk(), circle(), circle_cross(), circle_x(), cross(), diamond(), diamond_cross(), inverted_triangle()
# square(), square_cross(), square_x(), triangle(), x()

p = figure(plot_width=600, plot_height=400,x_range = [0,3], y_range = [0,7])

p.circle_cross(1, 1, size = 30, alpha = 0.5, legend = \'circle_cross\')
p.asterisk(1, 2, size = 30, alpha = 0.5, legend = \'asterisk\')
p.circle_x(1, 3, size = 30, alpha = 0.5, legend = \'circle_x\')
p.cross(1, 4, size = 30, alpha = 0.5, legend = \'cross\')
p.diamond(1, 5, size = 30, alpha = 0.5, legend = \'diamond\')
p.diamond_cross(1, 6, size = 30, alpha = 0.5, legend = \'diamond_cross\')
p.inverted_triangle(2, 1, size = 30, alpha = 0.5, legend = \'inverted_triangle\')
p.square(2, 2, size = 30, alpha = 0.5, legend = \'square\')
p.square_cross(2, 3, size = 30, alpha = 0.5, legend = \'square_cross\')
p.square_x(2, 4, size = 30, alpha = 0.5, legend = \'square_x\')
p.triangle(2, 5, size = 30, alpha = 0.5, legend = \'triangle\')
p.x(2, 6, size = 30, alpha = 0.5, legend = \'x\')

p.legend.location = "bottom_right"
# 设置图例位置

show(p)
# 详细参数可参考文档:http://bokeh.pydata.org/en/latest/docs/reference/plotting.html#bokeh.plotting.figure.Figure.circle

以上是关于Python交互图表可视化Bokeh:3. 散点图的主要内容,如果未能解决你的问题,请参考以下文章