Python第三方库之openpyxl
Posted 吴依杰
tags:
篇首语:本文由小常识网(cha138.com)小编为大家整理,主要介绍了Python第三方库之openpyxl相关的知识,希望对你有一定的参考价值。
Python第三方库之openpyxl(3)
区域图
区域图类似于折线图,绘图线下面的区域会被填充,通过将分组设置为“standard”、“stacked”或“percentStacked”,可以获得不同的变体;“standard”是默认的。
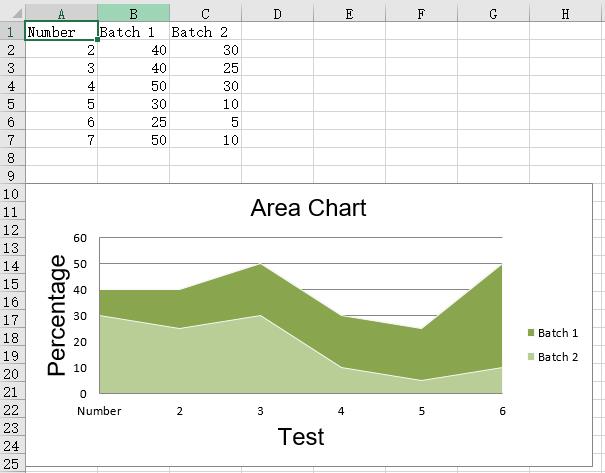
2D区域图
from openpyxl import Workbook
from openpyxl.chart import (
    AreaChart,
    Reference,
    Series,
)

wb = Workbook()
ws = wb.active

rows = [
    [\'Number\', \'Batch 1\', \'Batch 2\'],
    [2, 40, 30],
    [3, 40, 25],
    [4, 50, 30],
    [5, 30, 10],
    [6, 25, 5],
    [7, 50, 10],
]

for row in rows:
    ws.append(row)

chart = AreaChart()
chart.title = "Area Chart"
chart.style = 13
chart.x_axis.title = \'Test\'
chart.y_axis.title = \'Percentage\'

cats = Reference(ws, min_col=1, min_row=1, max_row=7)
data = Reference(ws, min_col=2, min_row=1, max_col=3, max_row=7)
chart.add_data(data, titles_from_data=True)
chart.set_categories(cats)

ws.add_chart(chart, "A10")

wb.save("area.xlsx")
运行结果:
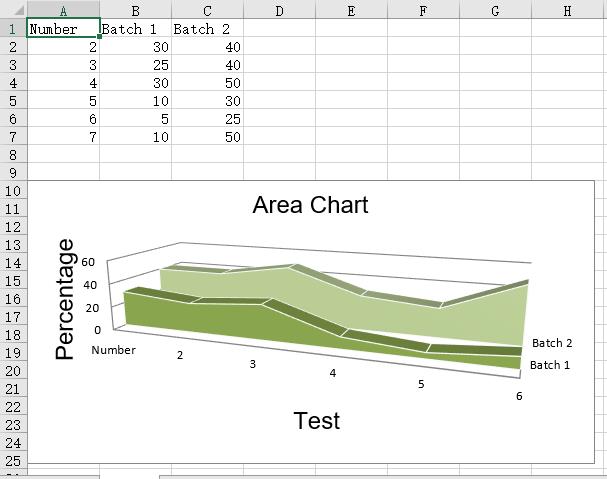
3D区域图
from openpyxl import Workbook
from openpyxl.chart import (
    AreaChart3D,
    Reference,
    Series,
)

wb = Workbook()
ws = wb.active

rows = [
    [\'Number\', \'Batch 1\', \'Batch 2\'],
    [2, 30, 40],
    [3, 25, 40],
    [4 ,30, 50],
    [5 ,10, 30],
    [6,  5, 25],
    [7 ,10, 50],
]

for row in rows:
    ws.append(row)

chart = AreaChart3D()
chart.title = "Area Chart"
chart.style = 13
chart.x_axis.title = \'Test\'
chart.y_axis.title = \'Percentage\'
chart.legend = None

cats = Reference(ws, min_col=1, min_row=1, max_row=7)
data = Reference(ws, min_col=2, min_row=1, max_col=3, max_row=7)
chart.add_data(data, titles_from_data=True)
chart.set_categories(cats)

ws.add_chart(chart, "A10")

wb.save("area3D.xlsx")
运行结果
以上是关于Python第三方库之openpyxl的主要内容,如果未能解决你的问题,请参考以下文章