聚类
数据是么有标签的,属于无监督学习
使用scipy包中的函数
hierarchical clustering
-
层次聚类/系统聚类
-
linkage:聚合距离函数
-
fcluster:层次聚类函数
-
dendrogram()
原理
计算样本之间的距离。每次将距离最近的点合并到同一个类。然后,再计算类与类之间的距离,将距离最近的类合并为一个大类。不停的合并,直到合成了一个类。其中类与类的距离的计算方法有:最短距离法,最长距离法,中间距离法,类平均法等。比如最短距离法,将类与类的距离定义为类与类之间样本的最短距离
scipy实现
- linkage()h函数实现层次聚类,
- dendrogram()函数能够根据聚类的结果画出层次树,
- fcluster()函数能够提取出聚类的结果(可以根据临界值返回聚类结果,或者根据聚类数返回聚类结果
- 通过seaborn进行可视化展示
linkage()
- 聚合函数
scipy.cluster.hierarchy.linkage(y, method=\'single\', metric=\'euclidean\', optimal_ordering=False)
参数
- y:可以是1维压缩向量(距离向量),也可以是2维观测向量(坐标矩阵)。若y是1维压缩向量,则y必须是n个初始观测值的组合,n是坐标矩阵中成对的观测值
- method:簇间度量方法,包括single,complete,ward等
- metric:样本间距离度量,包括欧氏距离,切比雪夫距离等知乎
dendrogram()
- 层次聚类树函数
或者叫做谱系图
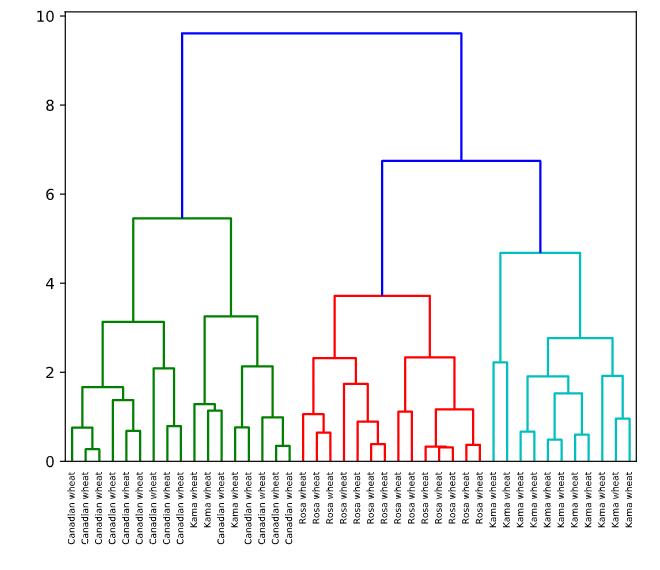
The dendrogram illustrates how each cluster is composed by drawing a U-shaped link between a non-singleton cluster and its children. The top of the U-link indicates a cluster merge. The two legs of the U-link indicate which clusters were merged. The length of the two legs of the U-link represents the distance between the child clusters. It is also the cophenetic distance between original observations in the two children clusters.
可以通过谱系图选择聚类数量
复现
# Perform the necessary imports
from scipy.cluster.hierarchy import linkage, dendrogram
import matplotlib.pyplot as plt
from scipy.cluster.hierarchy import fcluster
# Calculate the linkage: mergings
mergings = linkage(samples,method=\'complete\')

# Plot the dendrogram, using varieties as labels
dendrogram(mergings,
           labels=varieties,
           leaf_rotation=90,
           leaf_font_size=6,
)
plt.show()
# Use fcluster to extract labels: labels
labels = fcluster(mergings, 6, criterion=\'distance\')

# Create a DataFrame with labels and varieties as columns: df
df = pd.DataFrame({\'labels\': labels, \'varieties\': varieties})

# Create crosstab: ct
ct = pd.crosstab(df[\'labels\'], df[\'varieties\'])

# Display ct
print(ct)

##<script.py> output:
    varieties  Canadian wheat  Kama wheat  Rosa wheat
    labels
    1                      14           3           0
    2                       0           0          14
    3                       0          11           0

# Import linkage and fcluster functions
from scipy.cluster.hierarchy import linkage, fcluster

# Use the linkage() function to compute distances
Z = linkage(df, \'ward\')

# Generate cluster labels
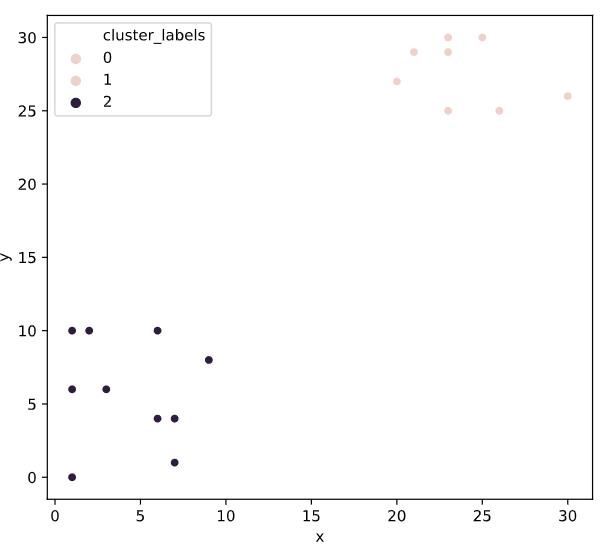
df[\'cluster_labels\'] = fcluster(Z, 2, criterion=\'maxclust\')

# Plot the points with seaborn
sns.scatterplot(x=\'x\', y=\'y\', hue=\'cluster_labels\', data=df)
plt.show()

系统聚类的缺陷
这个容我想想
timeit
timeit模块可以用来测试小段代码的运行时间
%timeit()
# Fit the data into a hierarchical clustering algorithm
distance_matrix = linkage(fifa[[\'scaled_sliding_tackle\', \'scaled_aggression\']], \'ward\')
# Fit the data into a hierarchical clustering algorithm
distance_matrix = linkage(fifa[[\'scaled_sliding_tackle\', \'scaled_aggression\']], \'ward\')

# Assign cluster labels to each row of data
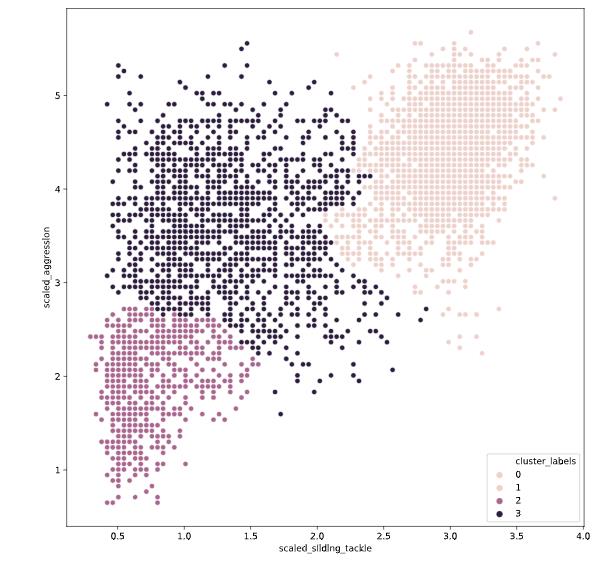
fifa[\'cluster_labels\'] =fcluster(distance_matrix , 3, criterion=\'maxclust\')
# Display cluster centers of each cluster
print(fifa[[\'scaled_sliding_tackle\', \'scaled_aggression\', \'cluster_labels\']].groupby(\'cluster_labels\').mean())
# Create a scatter plot through seaborn
sns.scatterplot(x=\'scaled_sliding_tackle\', y=\'scaled_aggression\', hue=\'cluster_labels\', data=fifa)
plt.show()

kmeans
均值聚类
- 使用vq函数将样本数据中的每个样本点分配给一个中心点,形成n个聚类vq
- whiten:白化预处理是一种常见的数据预处理方法,作用是去除样本数据的冗余信息
Normalize a group of observations on a per feature basis.
原理and步骤
- 是随机选取K个对象作为初始的聚类中心,
- 计算每个对象与各个种子聚类中心之间的距离,把每个对象分配给距离它最近的聚类中心,
- 聚类中心以及分配给它们的对象就代表一个聚类,
- 每分配一个样本,聚类的聚类中心会根据聚类中现有的对象被重新计算。这个过程将不断重复直到满足某个终止条件,
- 终止条件可以是没有(或最小数目)对象被重新分配给不同的聚类,没有(或最小数目)聚类中心再发生变化,误差平方和局部最小。
数学推导
-
对于一组没有标签的数据集X
\\(X=\\left[\\begin{array}{c}{x^{(1)}} \\\\ {x^{(2)}} \\\\ {\\vdots} \\\\ {x^{(m)}}\\end{array}\\right]\\) -
把这个数据集分成\\(k\\)个簇\\(C_{k}\\),\\(C=C_{1}, C_{2}, \\dots, C_{k}\\)
-
最小化的损失函数为,也就是即便函数distortion
达到最小即为收敛
\\(E=\\sum_{i=1}^{k} \\sum_{x \\in C_{i}}\\left\\|x-\\mu_{i}\\right\\|^{2}\\) -
其中\\(\\mu_{i}\\)为簇\\(C_{i}\\)的中心点:
\\(\\mu_{i}=\\frac{1}{\\left|C_{i}\\right|} \\sum_{x \\in C i} x\\) -
找到最优聚类簇,需要对每一个解进行遍历,因此,k-means使用贪心算法对每个解进行遍历
-
1.在样本中随机选取\\(k\\)个样本点充当各个簇的中心点\\(\\left\\{\\mu_{1}, \\mu_{2}, \\dots, \\mu_{k}\\right\\}\\)
-
2.计算所有样本点与各个簇中心之间的距离 \\(\\operatorname{dist}\\left(x^{(i)}, \\mu_{j}\\right)\\),然后把样本点划入最近的簇中\\(x^{(i)} \\in \\mu_{\\text {nearest}}\\)
-
3.根据簇中已有的样本点,重新计算簇中心
\\(\\mu_{i}:=\\partial g(x) 1\\left|C_{i}\\right| \\sum_{x \\in C i} x\\)
-
重复步骤2,3
-
通俗理解
- 1.首先输入k的值,即我们希望将数据集经过聚类得到k个分组。
- 2.从数据集中随机选择k个数据点作为初始大哥(质心,Centroid)
- 3.对集合中每一个小弟,计算与每一个大哥的距离(距离的含义后面会讲),离哪个大哥距离近,就跟定哪个大哥。
- 4.这时每一个大哥手下都聚集了一票小弟,这时候召开人民代表大会,每一群选出新的大哥(其实是通过算法选出新的质心)。
- 5.如果新大哥和老大哥之间的距离小于某一个设置的阈值(表示重新计算的质心的位置变化不大,趋于稳定,或者说收敛),可以认为我们进行的聚类已经达到期望的结果,算法终止。
- 6.如果新大哥和老大哥距离变化很大,需要迭代3~5步骤
以上是关于Cluster Analysis in Python的主要内容,如果未能解决你的问题,请参考以下文章