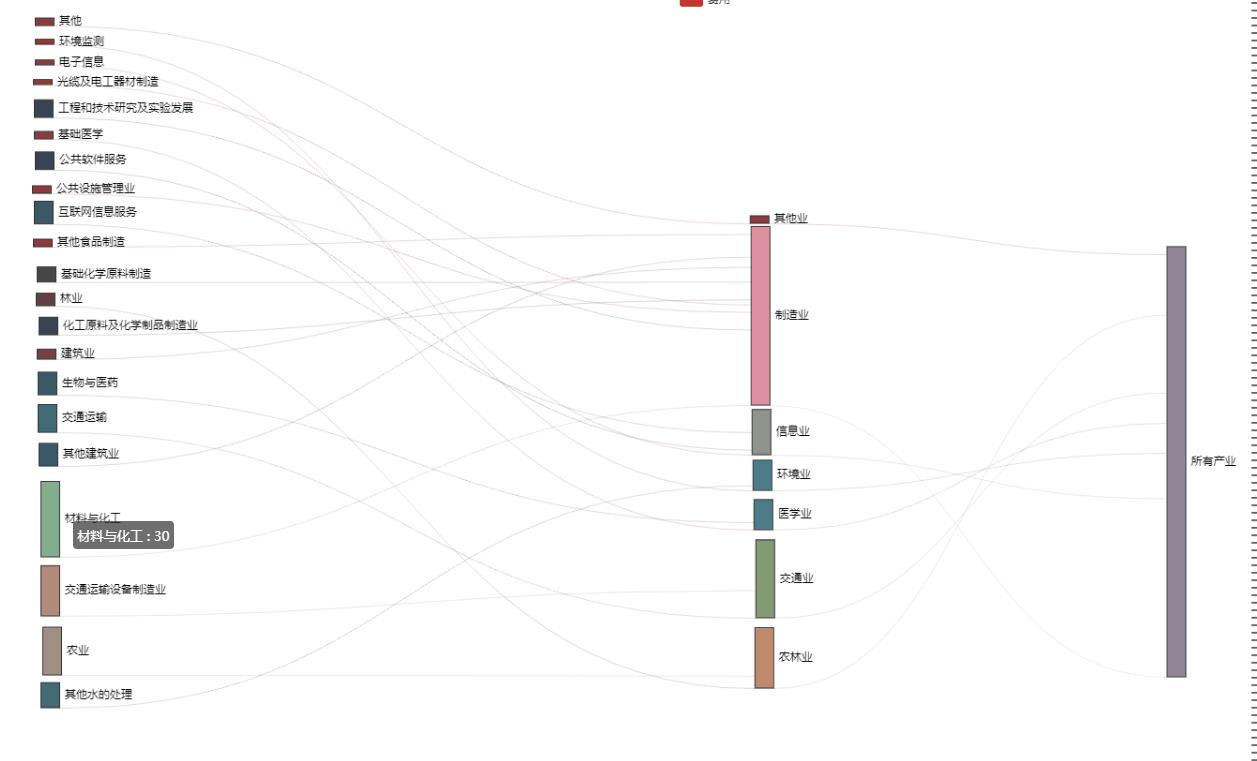
Python3画桑基图
Posted 赵墨涵66
tags:
篇首语:本文由小常识网(cha138.com)小编为大家整理,主要介绍了Python3画桑基图相关的知识,希望对你有一定的参考价值。
第一步:
安装pyecharts:
pip install pyecharts
第二步:整理数据
第三步:读入数据,画图
import pandas as pd
from pyecharts.charts import Page
from pyecharts.charts import Sankey
from pyecharts import options as opts
data=pd.read_csv(r\'D:\\\\Desktop\\\\test3.csv\',encoding=\'gbk\',header=None)
nodes=[]
nodes.append({\'name\':\'所有产业\'})
for i in data[0].unique():
    dic={}
    dic[\'name\']=i
    nodes.append(dic)
print(nodes)
links=[]
for i in data.values:
    dic={}
    dic[\'source\']=i[0]
    dic[\'target\']=i[1]
    dic[\'value\']=i[2]
    links.append(dic)
c=(
    Sankey()
    .add(
        "费用",
        nodes,
        links,
        linestyle_opt=opts.LineStyleOpts(opacity=0.2,curve=0.5,color="source",type_="dotted"),
        label_opts=opts.LabelOpts(position="right",),
    )
    .set_global_opts(title_opts=opts.TitleOpts(title="行业一览表"))
)
c.render(\'result1.html\')
运行结果:

总结:好用,简单易上手。
参考链接:http://www.360doc.com/content/19/0830/12/1489589_858033982.shtml
以上是关于Python3画桑基图的主要内容,如果未能解决你的问题,请参考以下文章