Python OpenCV ——Matplotlib显示图片
Posted
tags:
篇首语:本文由小常识网(cha138.com)小编为大家整理,主要介绍了Python OpenCV ——Matplotlib显示图片相关的知识,希望对你有一定的参考价值。
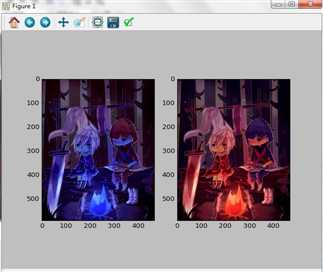
Color image loaded by OpenCV is in BGR mode.But Matplotlib displays in RGB mode.So color images will not be displayed correctly in Matplotlib if image is read with OpenCV.Please see the exercises for more details.(引自文档)
import numpy as np
import cv2
from matplotlib import pyplot as plt
‘‘‘
img = cv2.imread(‘cute.jpg‘,0)
plt.imshow(img,cmap=‘gray‘,interpolation=‘bicubic‘)
plt.xticks([],plt.yticks([]))  # to hide tick values on X and Y axis
plt.show()
‘‘‘

‘‘‘
Color image loaded by OpenCV is in BGR mode.
But Matplotlib displays in RGB mode.
So color images will not be displayed correctly in Matplotlib if image is read with OpenCV.
Please see the exercises for more details.
‘‘‘
img = cv2.imread(‘cute.jpg‘)
b, g, r = cv2.split(img)
img2 = cv2.merge([r,g,b])
# img2 = img[:,:,::-1]    this can be faster
plt.subplot(121);plt.imshow(img)  # expects distorted color
plt.subplot(122);plt.imshow(img2)  # expects true color
plt.show()

cv2.imshow(‘bgr image‘,img)  # expects true color
cv2.imshow(‘rgb image‘,img2)  # expects distrorted color
cv2.waitKey(0)
cv2.destroyAllWindows()
图像输出:
Matlpotlib输出:
OpenCV输出:

以上是关于Python OpenCV ——Matplotlib显示图片的主要内容,如果未能解决你的问题,请参考以下文章