python中matplotlib画折线图实例(坐标轴数字字符串混搭及标题中文显示)
Posted
tags:
篇首语:本文由小常识网(cha138.com)小编为大家整理,主要介绍了python中matplotlib画折线图实例(坐标轴数字字符串混搭及标题中文显示)相关的知识,希望对你有一定的参考价值。
最近在用python中的matplotlib画折线图,遇到了坐标轴 “数字+刻度” 混合显示、标题中文显示、批量处理等诸多问题。通过学习解决了,来记录下。如有错误或不足之处,望请指正。
一、最简单的基本框架如下:已知x,y,画出折线图并保存。此时x和y均为数字。
 1 # -*- coding: utf-8 -*-
 2
 3 import matplotlib.pyplot as plt #引入matplotlib的pyplot子库,用于画简单的2D图
 4 import random
 5
 6 x= range(0,20)
 7 y= [random.randint(0,20) for _ in range(20)]
 8
 9 #建立对象
10 fig = plt.figure(figsize=(8,6))
11 ax = fig.add_subplot()
12
13 #画图
14 plt.plot(x,y,‘o-‘,label=u"线条")    #画图
15 plt.show()
16 plt.savefig("temp.png")
二、坐标轴增加字母元素:
用到了如下语句和函数【参考:http://matplotlib.org/examples/ticks_and_spines/tick_labels_from_values.html】:
from matplotlib.ticker import FuncFormatter, MaxNLocator
labels = list(‘abcdefghijklmnopqrstuvwxyz‘)
def format_fn(tick_val, tick_pos):
if int(tick_val) in xs:
return labels[int(tick_val)]
else:
return ‘‘
ax.xaxis.set_major_formatter(FuncFormatter(format_fn))
ax.xaxis.set_major_locator(MaxNLocator(integer=True))
稍微改动,用到了之前的程序里:
 1 # -*- coding: utf-8 -*-
 2
 3 import matplotlib.pyplot as plt    #引入matplotlib的pyplot子库,用于画简单的2D图
 4
 5 from matplotlib.ticker import FuncFormatter, MaxNLocator
 6
 7 import random
 8
 9 x= range(20)
10
11 y= [random.randint(0,20) for _ in range(20)]
12
13 fig = plt.figure(figsize=(8,6))
14 ax = fig.add_subplot(111)              #建立对象
15
16 labels = [1,2,3,4,5,6,7,8,9,10,‘a‘,‘b‘,‘cc‘,‘d‘,‘e‘,‘f‘,‘g‘,‘h‘,‘*%$‘,‘20‘]
17
18
19 def format_fn(tick_val, tick_pos):
20     if int(tick_val) in x:
21         return labels[int(tick_val)]
22     else:
23         return ‘‘
24
25 ax.xaxis.set_major_formatter(FuncFormatter(format_fn))
26 ax.xaxis.set_major_locator(MaxNLocator(integer=True))
27
28 plt.plot(x,y,‘o-‘,label=u"线条")    #画图
29 plt.show()
30 plt.savefig("temp.png")
这样坐标轴既可以含有字符串,同时也可以含有数字。
三、标题等的中文显示:
用到了如下库和语句:
from matplotlib.font_manager import FontProperties
font1 = FontProperties(fname=r"c:\\windows\\fonts\\simsun.ttc",size=8) #可指定计算机内的任意字体,size为字体大小
plt.title(u"标题",fontproperties=font1)
plt.xlabel(u"x轴)",fontproperties=font1)
plt.ylabel(u"Y轴",fontproperties=font1)
ax.legend(prop=font1, loc="upper right")
这样用到上面程序里,则可以显示中文:
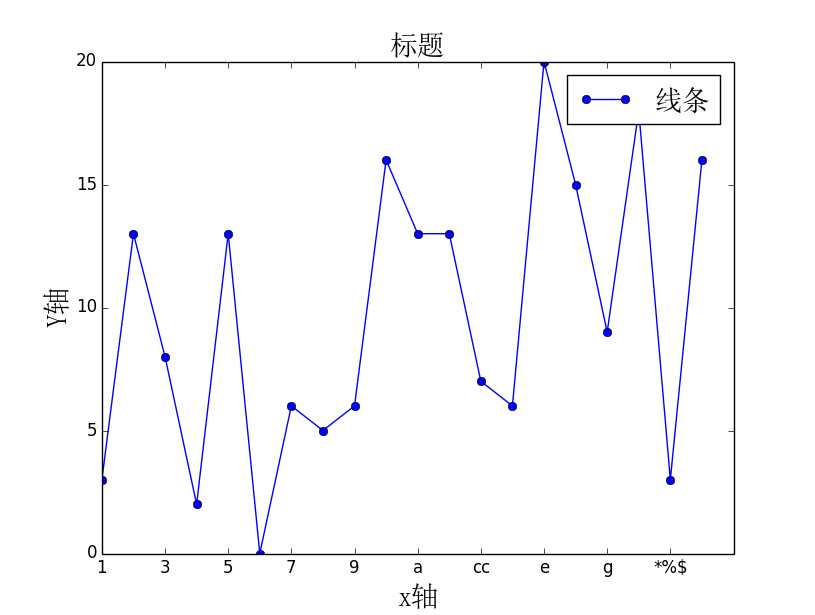
# -*- coding: utf-8 -*-

import matplotlib.pyplot as plt    #引入matplotlib的pyplot子库,用于画简单的2D图
from matplotlib.ticker import FuncFormatter, MaxNLocator
import random
from matplotlib.font_manager import FontProperties

x= range(20)

y= [random.randint(0,20) for _ in range(20)]

fig = plt.figure(figsize=(8,6))
ax = fig.add_subplot(111)              #建立对象

labels = [1,2,3,4,5,6,7,8,9,10,‘a‘,‘b‘,‘cc‘,‘d‘,‘e‘,‘f‘,‘g‘,‘h‘,‘*%$‘,‘20‘]


def format_fn(tick_val, tick_pos):
    if int(tick_val) in x:
        return labels[int(tick_val)]
    else:
        return ‘‘

ax.xaxis.set_major_formatter(FuncFormatter(format_fn))
ax.xaxis.set_major_locator(MaxNLocator(integer=True))
#可指定计算机内的任意字体,size为字体大小
font1 = FontProperties(fname=r"c:\\windows\\fonts\\simsun.ttc",size=20)
plt.title(u"标题",fontproperties=font1)
plt.xlabel(u"x轴",fontproperties=font1)
plt.ylabel(u"Y轴",fontproperties=font1)

plt.plot(x,y,‘o-‘,label=u"线条")    #画图
ax.legend(prop=font1, loc="upper right")
plt.show()
plt.savefig("temp.png")
画出的图如下:
四、不显示图片,以便进行批处理:
import matplotlib
matplotlib.use(‘Agg‘)
需加在 import matplotlib.pyplot as plt 之前,然后删掉plt.show()即可。
以上是关于python中matplotlib画折线图实例(坐标轴数字字符串混搭及标题中文显示)的主要内容,如果未能解决你的问题,请参考以下文章